What Are Cognitive Artifacts? How External Tools Shape Thinking and Learning
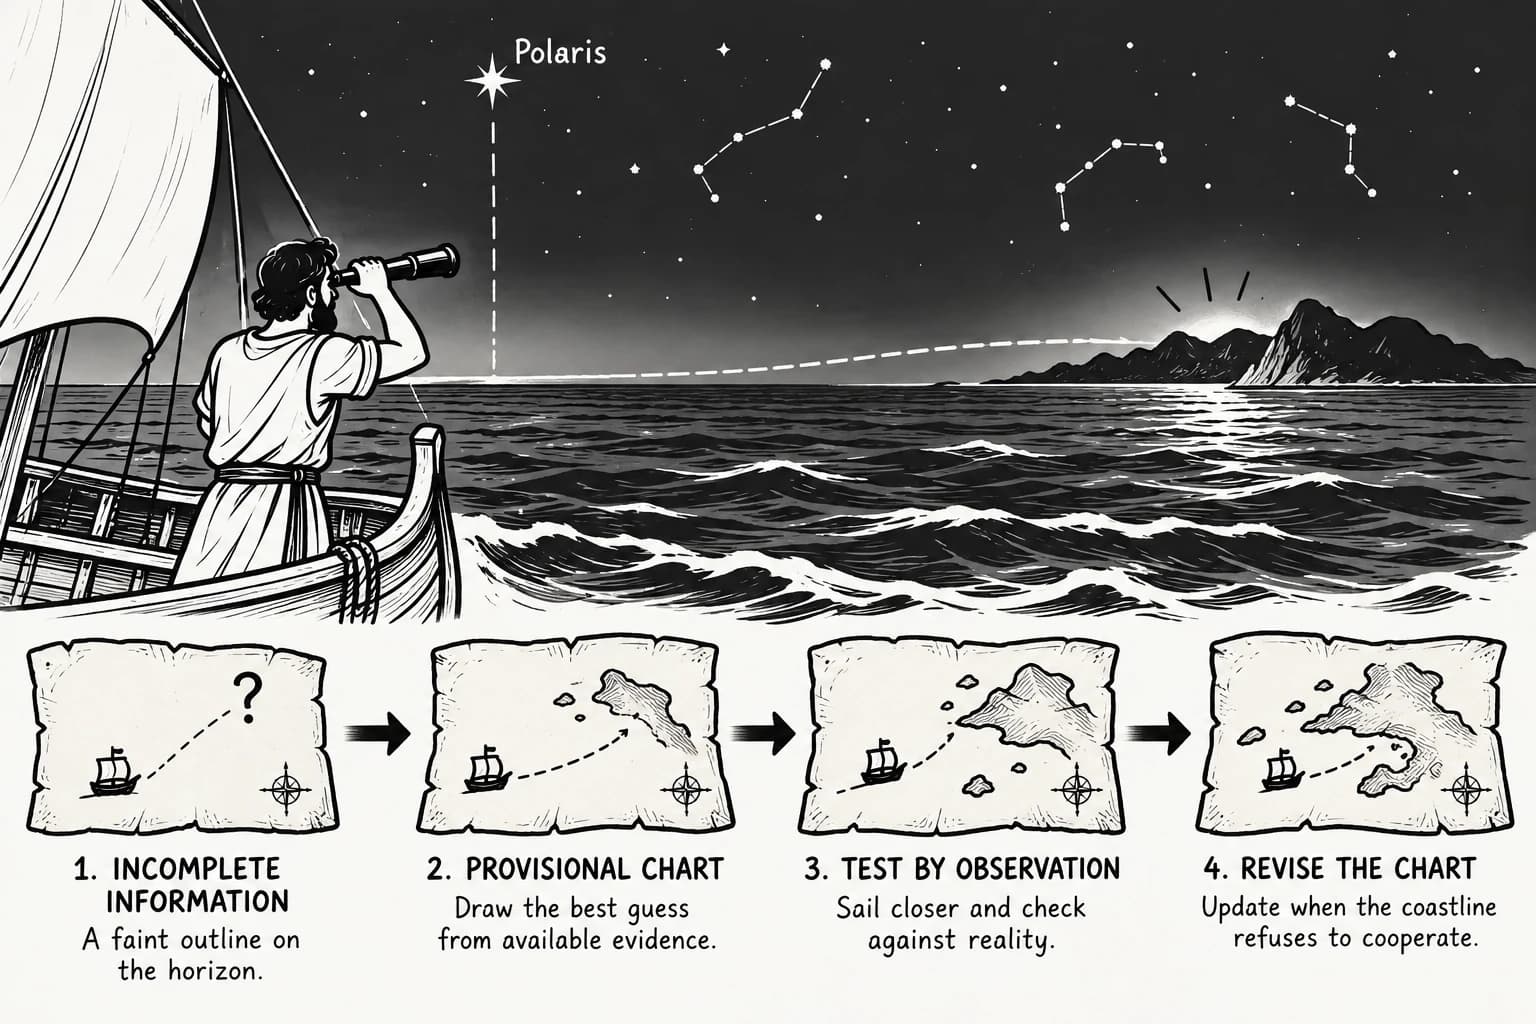
For more than a thousand years, sailors crossed seas they could not fully see by carrying a small brass instrument engraved with circles, stars, and moving pointers. The astrolabe never sailed the ship, yet entire civilizations trusted it to transform an overwhelming sky into a navigable system. Before a captain chose a course, the instrument converted scattered observations into meaningful structure, reducing uncertainty without removing complexity. Long before Donald Norman coined the term cognitive artifacts, astronomers, navigators, architects, physicians, and scholars had already discovered the same principle: people think better when part of the thinking is embodied in a carefully designed representation. Today's AI summaries, AI mind maps, concept maps, knowledge graphs, and AI learning tools inherit exactly this tradition. They are not substitutes for intelligence but external representations that reshape working memory, improve knowledge organization, support distributed cognition, reduce cognitive load, and allow learners to spend less effort navigating information and more effort understanding it.
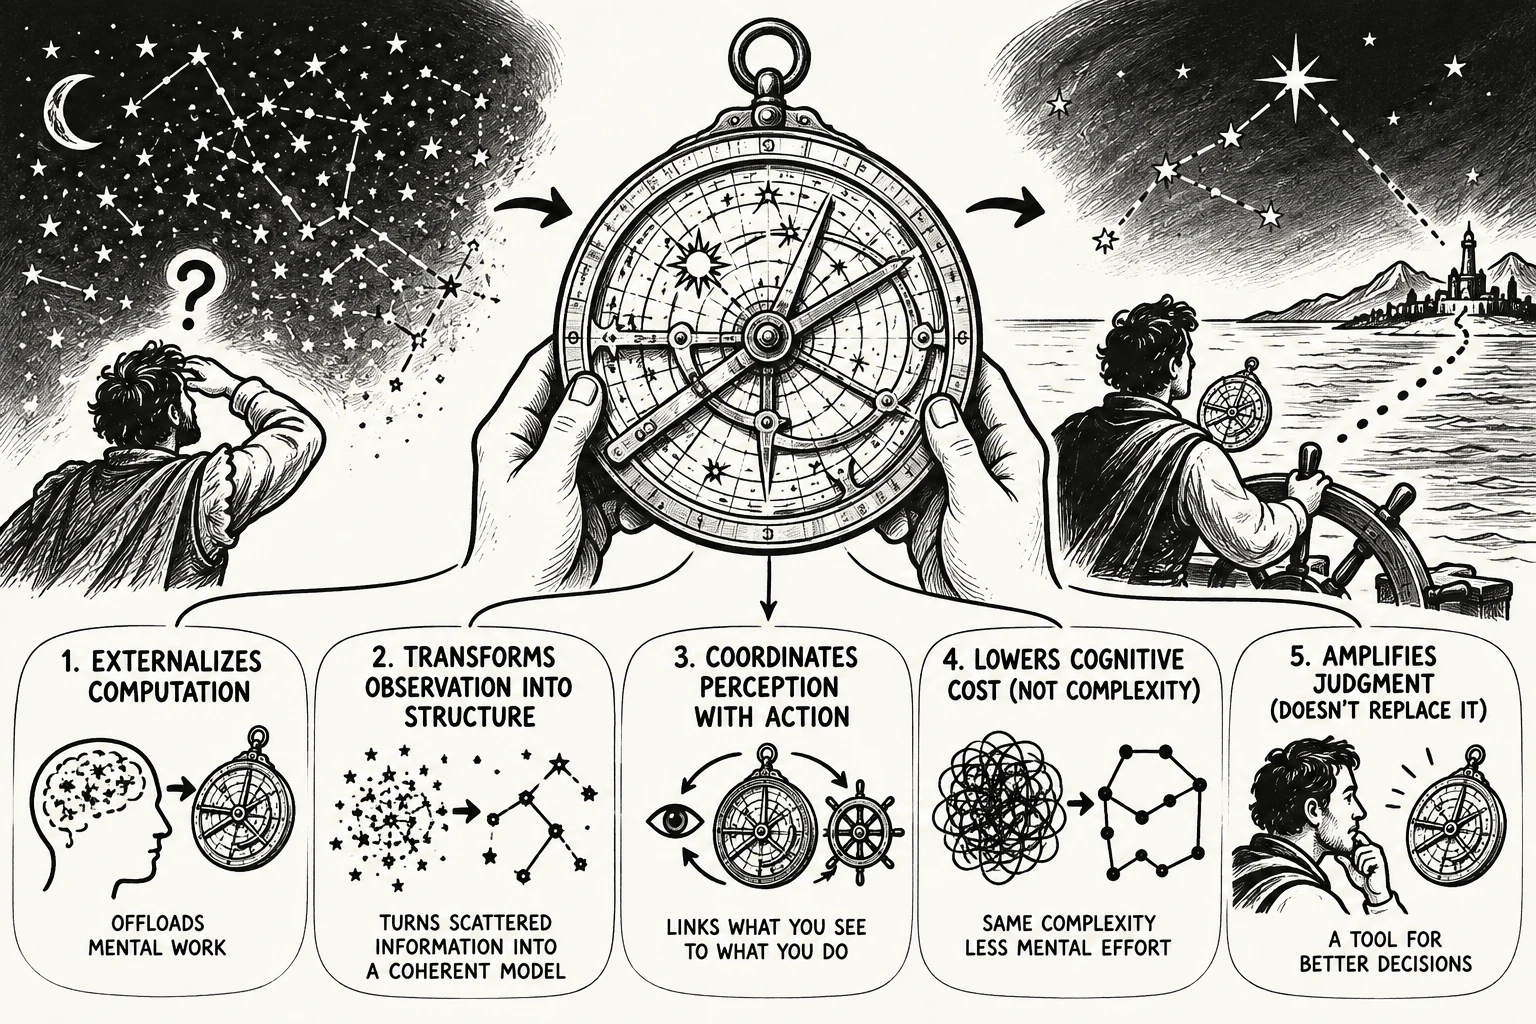
Like an astrolabe, every effective cognitive artifact performs five complementary functions before genuine thinking begins.
-
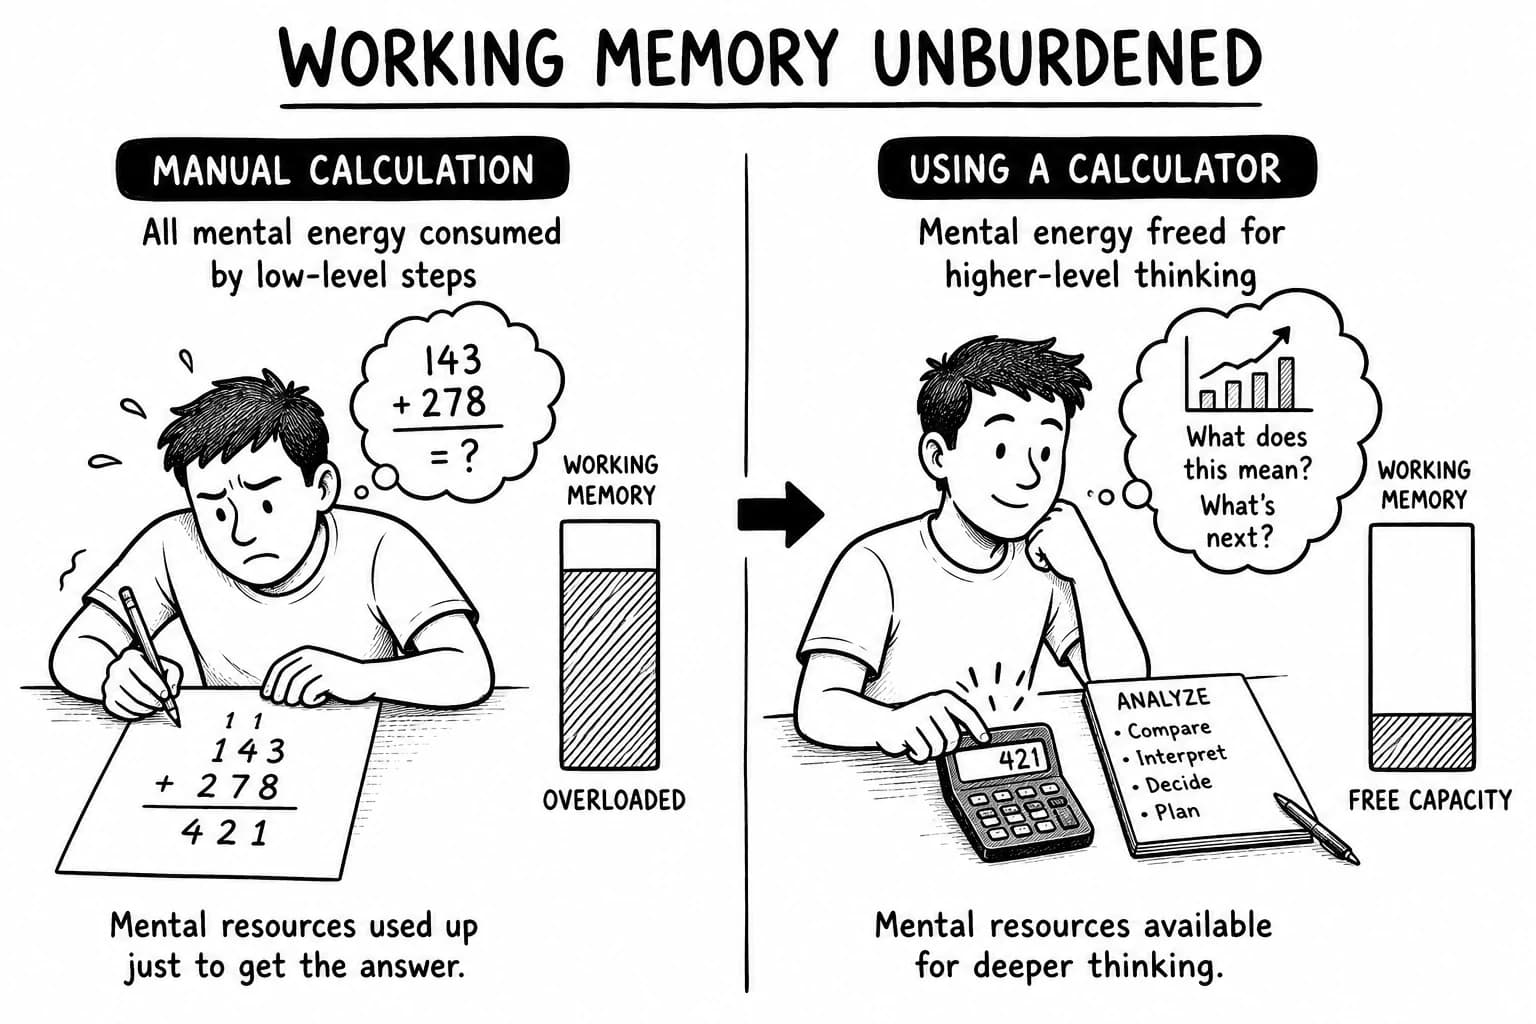
It externalizes computation. Medieval navigators delegated complex astronomical calculations to the astrolabe, just as modern cognitive artifacts, AI summaries, knowledge graphs, and concept maps reduce unnecessary working memory demands through cognitive offloading rather than memorization.
-
It transforms observation into structure. The rotating plates of an astrolabe converted scattered stars into a coherent navigational model, illustrating how external representations, schema formation, knowledge representation, semantic networks, and pattern recognition organize information before reasoning begins.
-
It coordinates perception with action. Sailors continuously compared the instrument with the sky, embodying distributed cognition, interactive reasoning, human-computer interaction, decision support, and cognitive technology, where thinking emerges through interaction between people and artifacts rather than memory alone.
-
It lowers cognitive cost without lowering complexity. The heavens remained infinitely complicated, yet the instrument dramatically reduced extraneous cognitive load, improved mental effort allocation, supported working memory, and increased learning efficiency through better representations rather than simpler problems.
-
It amplifies judgment instead of replacing it. A skilled navigator still interpreted weather, currents, and risk. Likewise, modern AI educational technology, AI tutors, AI mind maps, AI study assistants, and generative AI provide scaffolding that supports knowledge synthesis, learning, and decision making, while human understanding remains the final authority.
The History of Cognitive Artifacts: From the Astrolabe to AI Knowledge Systems
| Period | Historical Milestone | Cognitive Artifact & Knowledge Representation | Core Cognitive Concepts | Modern AI Learning Equivalent |
|---|---|---|---|---|
| 2nd century BCE | Development of the Astrolabe in Hellenistic astronomy | External representation transforms celestial observations into navigable structure | External cognition, knowledge representation, schema formation, pattern recognition, decision support | AI concept maps, AI knowledge graphs |
| 8th–13th centuries | Islamic scholars refine astronomical instruments and navigation | Astrolabes become practical reasoning tools for navigation, astronomy, mathematics, and education | Distributed cognition, interactive reasoning, cognitive technology, scientific visualization | AI educational tools, intelligent tutoring systems |
| 15th–16th centuries | Age of Exploration relies on navigational artifacts | External tools coordinate observation, calculation, and decision making across uncertain environments | Cognitive offloading, working memory reduction, situational awareness, human-computer interaction | AI copilots, AI research assistants |
| 1991 | Donald Norman defines cognitive artifacts | External devices maintain, display, and manipulate information to improve cognition | Cognitive artifacts, external representations, distributed cognition, human-centered design | AI summaries, AI note taking |
| 1993–1995 | Things That Make Us Smart and Cognition in the Wild | Cognition extends beyond individuals into tools, environments, and teams | Distributed cognition, team cognition, navigation artifacts, cockpit ethnography | Collaborative AI workspaces |
| 1994 | Zhang & Norman | Identical information produces different reasoning depending on representation | Representation effects, schema construction, visual cognition, knowledge visualization | AI mind maps, semantic diagrams |
| 2006–2016 | Kirsh, Risko & Gilbert, Zhang & Patel, Vallée-Tourangeau | Research explains why manipulating external representations changes reasoning efficiency | Cognitive offloading, interactive reasoning, working memory, external representations, learning sciences | AI learning workflows, adaptive learning systems |
| Today | Generative AI produces cognitive artifacts on demand | AI dynamically generates summaries, concept maps, glossaries, visual explanations, and learning pathways | AI learning tools, generative AI, knowledge synthesis, personalized learning, AI educational technology | ChatGPT, Claude, Gemini, NotebookLM |
How Cognitive Artifacts Work: From the Astrolabe to AI Mind Maps
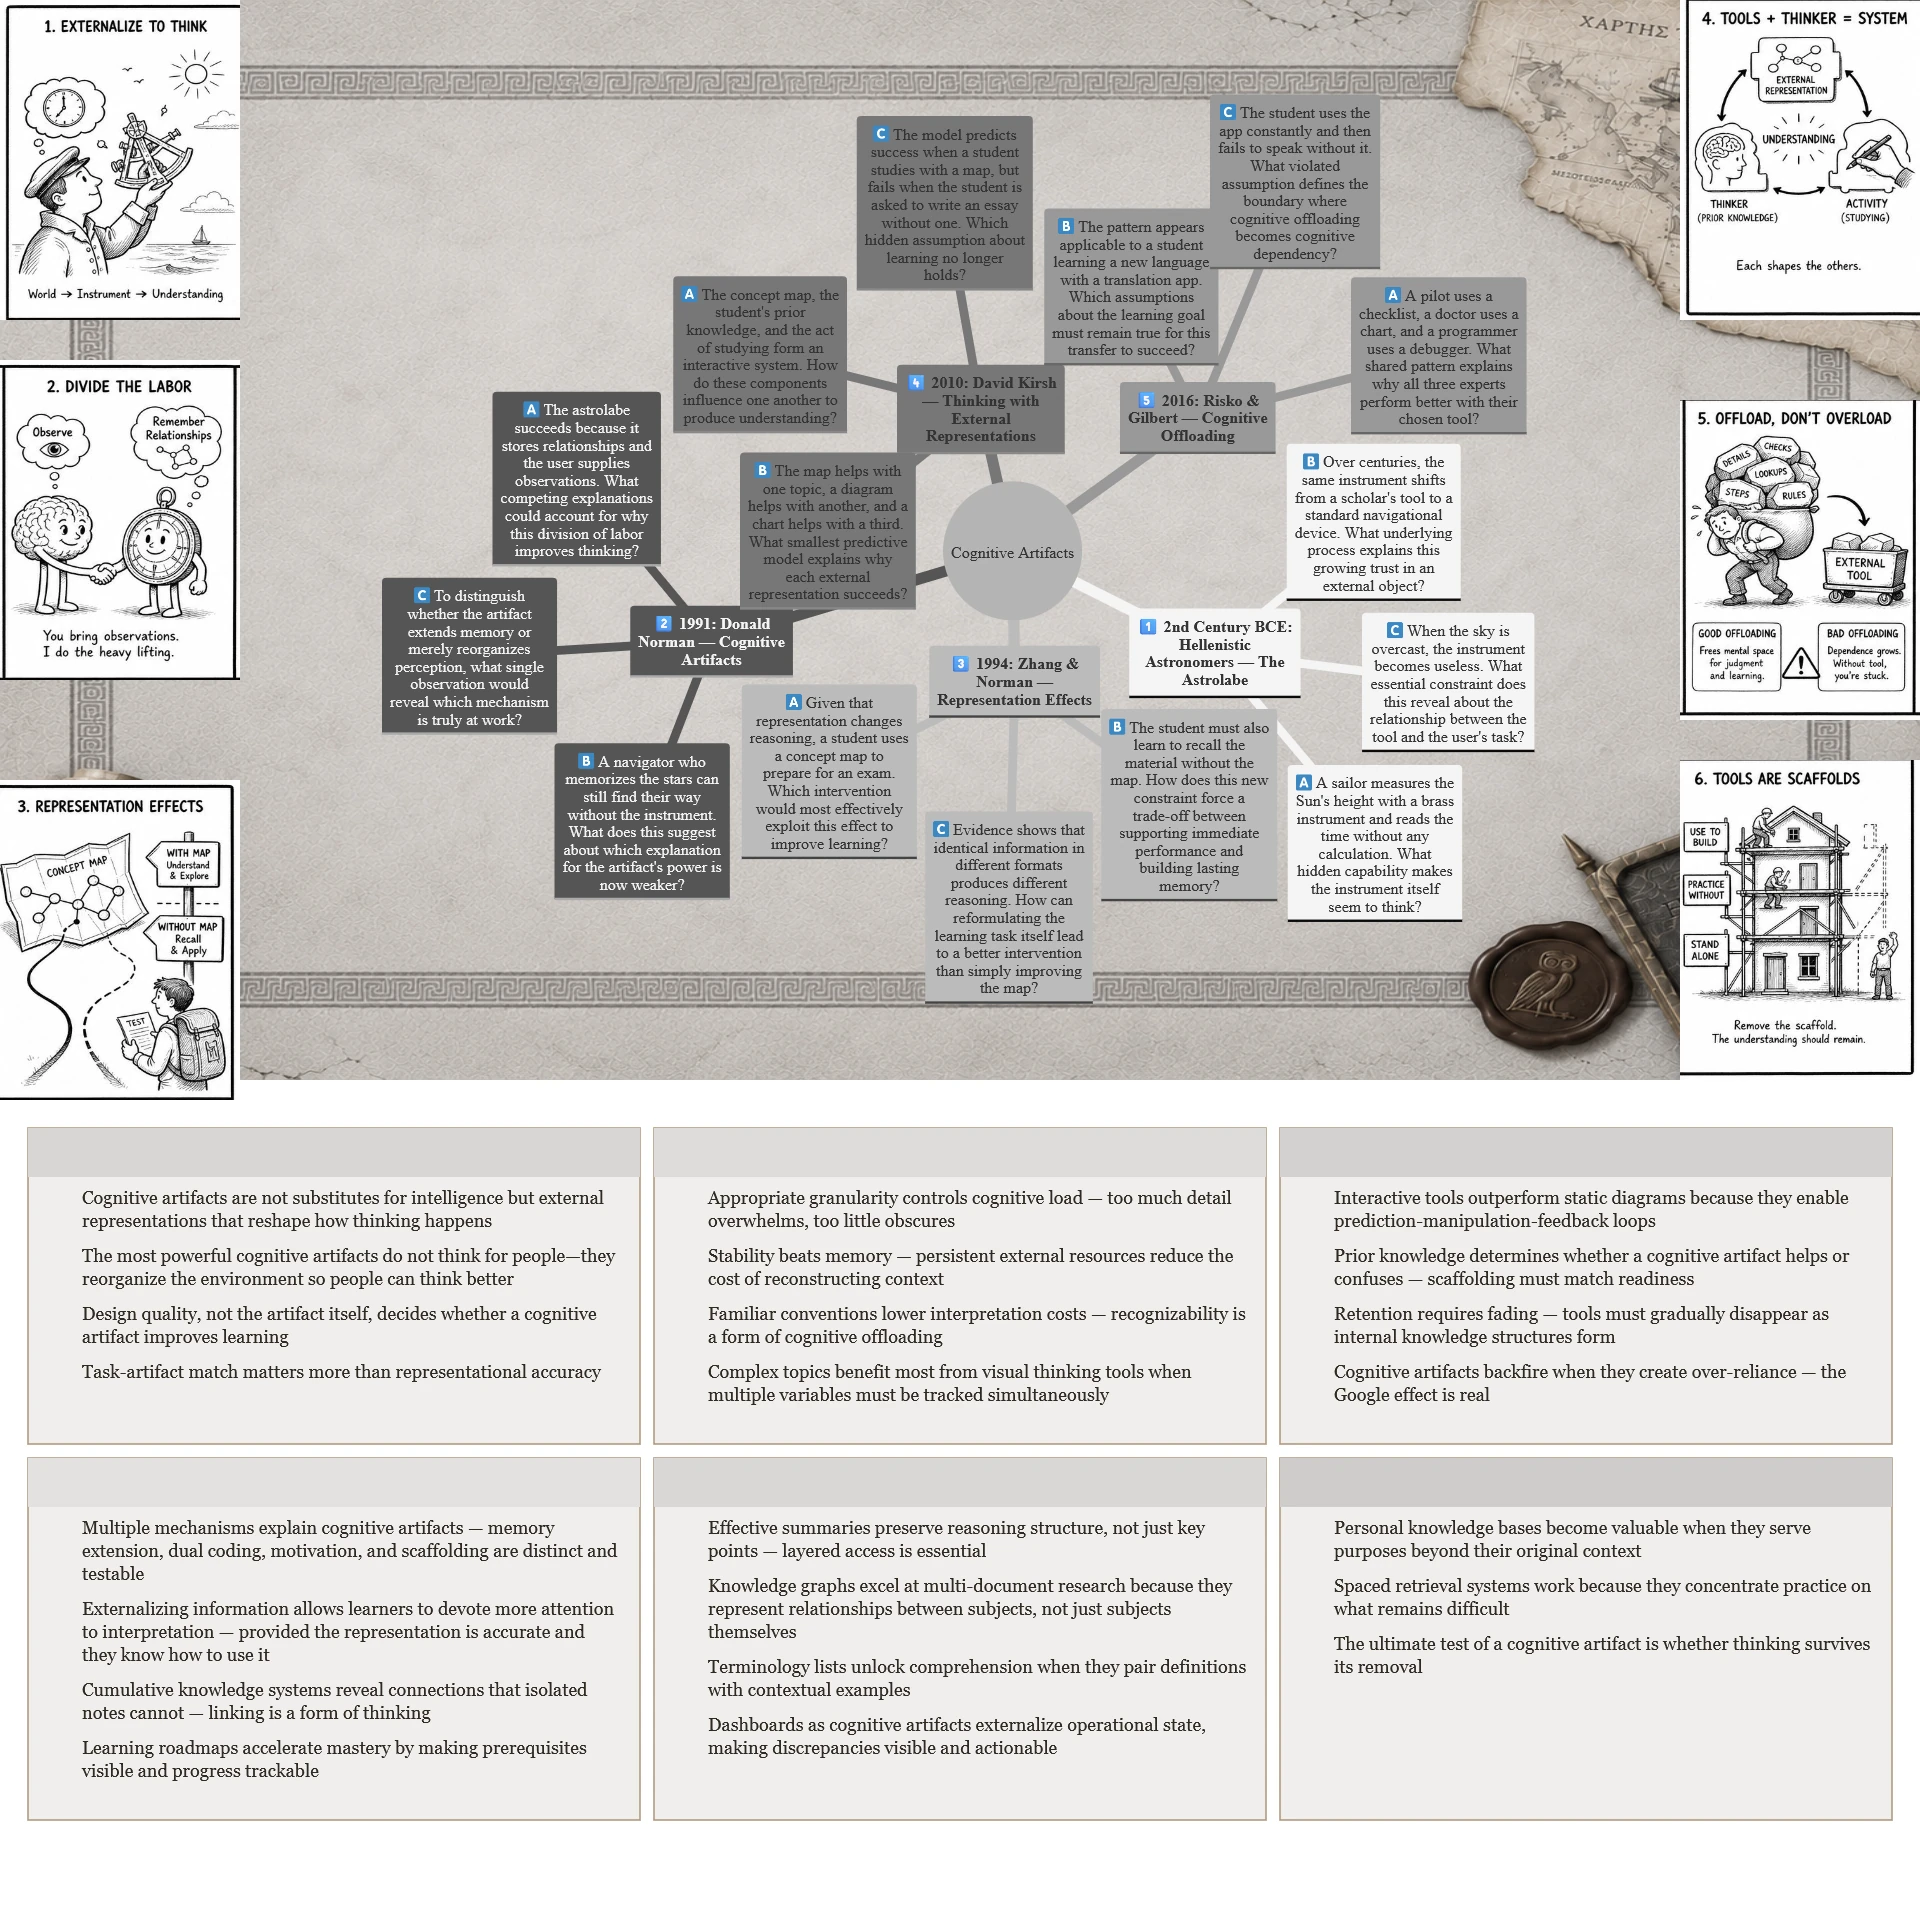
When Portuguese navigators pushed beyond familiar coastlines during the Age of Exploration, no captain attempted to calculate the heavens entirely in memory. The astrolabe transformed scattered stars into a shared computational surface where observation, calculation, and judgment became distributed across sailors, instruments, charts, and accumulated knowledge—a living demonstration of distributed cognition centuries before Edwin Hutchins described it. The instrument did not simplify astronomy; it simplified access to astronomy by serving as a cognitive artifact that externalized computation, provided persistent external representations, replaced recall with recognition, reduced working memory demands through cognitive offloading, and encouraged epistemic actions such as measuring, rotating, comparing, verifying, and recalibrating. Modern AI mind maps, AI summaries, concept maps, knowledge graphs, advance organizers, and AI learning tools inherit precisely this architecture. Like the astrolabe, they reshape the cost structure of computation by transforming expensive mental reconstruction into inexpensive visual inspection, illustrating the representation effects demonstrated by Zhang & Norman (1994), the principles of external cognition and distributed cognition described by Donald Norman and Edwin Hutchins, the seven mechanisms of thinking with external representations proposed by Kirsh (2010), and the benefits of cognitive offloading synthesized by Risko & Gilbert (2016). Their greatest educational value emerges when learners actively group, compare, annotate, reorganize, trace relationships, and test hypotheses, converting passive information into knowledge representation, schema construction, pattern recognition, reasoning support, problem solving, creative thinking, and durable learning transfer. Across a millennium, brass instruments have become interactive diagrams and generative AI, yet the underlying principle remains remarkably unchanged: the most powerful cognitive artifacts do not think for people—they reorganize the environment so people can think better.
What Makes Something a Cognitive Artifact? Design Quality Decides Learning Benefit
When Florence Nightingale examined British Army mortality records after the Crimean War, she turned an embarrassingly uncooperative mountain of statistics into her famous polar-area diagrams. The resulting cognitive artifact turned statistical comparisons into visible patterns, demonstrating how external representations, visual cognition and knowledge visualization can make complex evidence easier to interpret.
| Identity Lens | What Florence Nightingale Did |
|---|---|
| Consistency | Nightingale organized mortality records into labeled monthly sectors, using consistent colors for disease, wounds and other causes. Her systematic labeling demonstrates how clear signifiers and visual mappings make information recognizable, reduce mental workload and encourage further organization. |
| Skills | Nightingale compared mortality statistics across months, revealing patterns that isolated observations could conceal. Repeatedly organizing and comparing visual representations develops pattern recognition, visual cognition and judgment about information hierarchy, readability and knowledge visualization. |
| Discipline / Grind | Nightingale systematically transformed mortality tables into statistical diagrams, carefully organizing categories, labels and visual proportions. Her repeated attention to representational detail illustrates how correcting ambiguous labels, misleading mappings and excessive visual density improves usability and prevents clutter from obscuring accurate information. |
| Motivation | Nightingale used colored statistical diagrams to make disease mortality patterns accessible to readers of her reports. Her work illustrates how high-quality external representations turn inference into perception, making complex evidence easier to interpret and improvements in visual communication more readily observable. |
| Learning & Expertise | Nightingale refined her statistical presentations to communicate mortality patterns and comparisons more effectively. Evaluating whether readers can interpret visual relationships accurately and efficiently develops expertise in discoverability, visibility, information hierarchy and cognitive artifact design. |
Cognitive Artifact vs Tool vs Scaffold: Why Task-Artifact Match Matters Most
The naive approach of accurately representing every bend and distance in London's expanding railway network made the map increasingly difficult for passengers to navigate. His diagram, first published in 1933, simplified railway lines into horizontal, vertical and diagonal segments, using consistent spacing and distinctive colors to make the network's connections visible.
| Identity Lens | What Harry Beck Did |
|---|---|
| Consistency | Beck standardized railway lines into horizontal, vertical and 45-degree segments, using consistent colors and interchange symbols to make connections recognizable. His task-artifact match illustrates why flowcharts suit processes, decision trees suit choices and taxonomies suit classification. |
| Skills | Beck redesigned the Underground map around passengers' need to identify routes and interchanges, prioritizing network connections over geographical accuracy. By matching representation to required operations, he demonstrated how a tool becomes a cognitive artifact that reduces unnecessary mental effort. |
| Discipline / Grind | Beck systematically simplified railway routes, removing geographical details that complicated navigation while preserving essential connections. His approach illustrates the value of repeatedly checking task-artifact fit and eliminating irrelevant information that increases extraneous cognitive load. |
| Motivation | Beck's initially rejected design received a favorable response during its 1932 trial and was subsequently adopted, demonstrating how clearer signifiers and mappings can make improvements in usability visible and encourage further refinement. |
| Learning & Expertise | Beck's schematic map made routes and interchanges easier to identify while sacrificing geographical precision, illustrating representation effects: a diagram succeeds when it supports the intended task, while mismatched artifacts omit required operations or introduce unnecessary complexity. |
How Much Detail Should AI Concept Maps Show? Appropriate Granularity Controls Load
When Marie Neurath helped develop the Vienna Method of Pictorial Statistics during the 1920s and 1930s, she faced a stubborn design problem: how could an ordinary reader understand mountains of economic, scientific and social statistics without becoming overwhelmed by their complexity?
| Identity Lens | What Marie Neurath Did |
|---|---|
| Consistency | Neurath repeatedly transformed complex statistics into recognizable visual groups, using chunking, information hierarchy and semantic organization to make central ideas immediately visible without overwhelming readers with unnecessary detail. |
| Skills | Neurath worked between subject experts and graphic designers, deciding which information readers needed first and which details could be presented separately, demonstrating how layered representations develop understanding from foundational concepts to complex relationships. |
| Discipline / Grind | Neurath systematically selected, grouped and simplified statistics before producing each Isotype chart, refining the level of abstraction until essential relationships remained clear. Her process illustrates Mayer's Cognitive Theory of Multimedia Learning: reduce extraneous load while preserving the information needed to understand intrinsically complex material. |
| Motivation | Neurath transformed intimidating statistical information into accessible visual explanations, allowing nonspecialists to recognize patterns. Testing whether readers could interpret these relationships provided feedback for refining information hierarchy and maintaining motivation through observable improvements. |
| Learning & Expertise | Neurath balanced statistical detail against readers' ability to interpret diagrams, refining visual arrangements to preserve essential relationships. Asking learners to explain patterns, identify missing information and evaluate usability helps calibrate granularity, manage intrinsic load and support meaningful learning. |
Why Must Thinking Tools Be Instantly Available? Stability Beats Memory
NASA's Apollo 13 mission records show that preplanned procedures, specialized consoles and coordinated flight-control teams helped Mission Control respond rapidly to the crash and track changing spacecraft conditions, coordinate decisions and develop revised procedures, including the improvised carbon dioxide filter that helped sustain the astronauts.
| Identity Lens | What NASA's Apollo 13 Team Did |
|---|---|
| Consistency | Mission Control kept continuously updated telemetry visible at specialized workstations, demonstrating how persistent external resources such as dashboards, notebooks and calendars support distributed cognition by reducing memory demands, split attention and the cost of reconstructing context. |
| Skills | Flight controllers used specialized consoles and shared displays to interpret changing spacecraft conditions, illustrating how situated cognition benefits from familiar navigation design, immediate information access and reduced context-switching. |
| Discipline / Grind | NASA maintained established procedures and workstations while developing revised emergency checklists, demonstrating how stable information locations, descriptive labels, indexing and clear information scent reduce retrieval effort and encoding cost. |
| Motivation | Mission Control coordinated changing information across successive teams through shared procedures and updated plans, preserving progress and making completed decisions visible. Persistent external resources reduce the frustration of repeatedly recovering context and reinforce confidence in complex workflows. |
| Learning & Expertise | NASA's teams reviewed mission data, tested revised procedures in simulators and communicated verified instructions to the astronauts, illustrating how feedback and Kirsh's distributed cognition perspective can guide improvements in information placement, retrieval accuracy and switching costs. |
Why Do Familiar Diagrams Teach Faster? Interpretability Lowers Cost
When American industrial designer Henry Dreyfuss helped develop standardized public information symbols for the US Department of Transportation in the 1970s, he faced a practical design challenge: travelers navigating unfamiliar airports and transport terminals needed to recognize essential facilities without deciphering a new visual language at every turn.
| Identity Lens | What Henry Dreyfuss Did | | -------------------- | ---------------------------------------------------------------------------------------------------------------------------------------------------------------------------------------------------------------------------------------------------------------------------------------------------------------------------- | --- | | Consistency | Dreyfuss compiled thousands of international symbols into his 1972 Symbol Sourcebook, organizing them into reusable categories that established familiar conventions and reduced interpretation costs—an approach applicable to semantic maps, process maps and systems maps. | | Skills | Dreyfuss compared symbols across industries and cultures, examining how familiar visual forms communicated different meanings. Repeated exposure to these analogical reasoning cues builds visual fluency, strengthens mental models and improves inference generation. | | Discipline / Grind | Dreyfuss systematically catalogued existing symbols before developing new representations, demonstrating how reusing established conventions, applying design constraints and correcting ambiguous signifiers can prevent misconceptions and support user-centered design. | | Motivation | Dreyfuss assembled an international symbol reference to make graphic communication more accessible across languages and professions, illustrating how recognizable conventions and clear affordances reduce interpretation effort and provide immediate feedback through successful recognition. | | Learning & Expertise | Dreyfuss classified symbols and documented alternative visual forms, making their meanings easier to compare. Evaluating familiar versus novel encodings, recording misinterpretations and refining ontology, taxonomy and metadata develops expertise in visual cognition, ecological psychology and representation design. | |
When Do Complex Topics Benefit Most From Visual Thinking Tools?
When French civil engineer Charles Joseph Minard mapped Napoleon's disastrous 1812 Russian campaign in 1869, he succesfully illustrated complex relationships across multiple variables within one coherent representation. is map also simplifies the campaign's actual military movements by using the width of colored bands to show troop strength, geographical positioning to trace the army's route and a temperature graph to document conditions during the retreat.
| Identity Lens | What Charles Minard Did |
|---|---|
| Consistency | Minard integrated troop strength, location, direction, distance, dates and temperature into one coherent diagram, demonstrating how graph visualization can make complex relationships visible and reduce the mental effort of tracking interconnected information. |
| Skills | Minard combined geographical mapping, proportional flow bands and a temperature graph, using complementary spatial arrangements to reveal relationships that separate charts would make harder to inspect—an example of cognitive offloading consistent with Kirsh's (2010) perspective. |
| Discipline / Grind | After decades of refining his flow maps, Minard developed the visual judgment to encode six interconnected variables, learning when complex graph visualization clarified relationships and when unnecessary detail could be removed. |
| Motivation | Minard transformed extensive historical statistics into a comprehensible visual account of Napoleon's military losses, illustrating how turning complex information into a clear systems map makes progress in visual reasoning observable and worth sharing. |
Are Interactive Visual Thinking Tools Better Than Static Diagrams?
When mathematician Seymour Papert helped develop the Logo programming language in the late 1960s, he wanted children to explore mathematics by actively experimenting with ideas. Instead of simply studying a finished geometric diagram, children could instruct a robotic or on-screen turtle to move forward, turn and draw.
| Identity Lens | What Seymour Papert Did |
|---|---|
| Consistency | Papert's Logo turtle encouraged children to repeatedly draw, trace and reorganize geometric shapes, demonstrating how five minutes of daily epistemic actions on interactive whiteboards or Figma boards can make active reasoning habitual. |
| Skills | Children programmed shapes, predicted outcomes and manipulated the turtle's movements, using immediate visual feedback to offload mental operations. The same active hypothesis testing in CAD, IDEs and interactive diagrams develops skills that static viewing alone may not support. |
| Discipline / Grind | When the turtle drew an unexpected shape, learners inspected their commands, traced errors and revised their instructions. This repeatable prediction–manipulation–feedback loop illustrates perception-action coupling and replaces superficial viewing with deliberate experimentation. |
| Motivation | Logo made every successful adjustment immediately visible, allowing children to compare predictions with results and demonstrate their discoveries. This interaction between action and perception, central to enactivism, provides observable progress that can sustain motivation. |
| Learning & Expertise | Papert investigated how children constructed mathematical understanding through interactive programming and debugging. Repeatedly grouping, tracing, comparing and reorganizing representations illustrates how epistemic actions can support cognitive offloading; reviewing which manipulations improve understanding helps distinguish productive interaction from unnecessary activity. |
Do You Need Prior Knowledge to Use AI Knowledge Maps?
When Maria Montessori opened her first Casa dei Bambini in Rome in 1907, she confronted a practical teaching challenge: children arrived with different levels of knowledge, independence and familiarity with learning materials. She developed a prepared environment with carefully sequenced materials, progressing from concrete sensory experiences toward increasingly abstract concepts. Children could manipulate objects, observe relationships and use built-in feedback to recognize mistakes before advancing to more demanding tasks.
| Identity Lens | What Maria Montessori Did |
|---|---|
| Consistency | Montessori introduced simple, concrete materials before progressing to complex abstractions, gradually building the prior knowledge, domain schema and familiarity with artifact types needed to interpret more advanced representations. |
| Skills | Montessori used concrete golden beads to demonstrate units, tens, hundreds and thousands before introducing abstract arithmetic, providing mental models and worked examples that learners could manipulate and explain through self-explanation. |
| Discipline / Grind | Montessori's three-period lesson progressed from naming an object to recognizing it and recalling its name independently, providing a repeatable sequence from foundational knowledge to higher-order understanding, comparable to progression through Bloom's taxonomy and SOLO. |
| Motivation | Montessori designed self-correcting materials that allowed children to discover errors, repeat exercises and observe their progress, supporting formative assessment, self-regulated learning and the confidence to explore alternative solutions through cognitive flexibility. |
| Learning & Expertise | Montessori observed each child's readiness and adjusted materials from concrete experiences to increasingly abstract challenges, anticipating principles compatible with constructivism and Kolb's experiential learning cycle while progressively engaging fluid reasoning and building crystallized knowledge. |
How to Remember Without the Tool? Retention Requires Fading
When German psychologist Hermann Ebbinghaus investigated memory in the late nineteenth century, he confronted an inconvenient problem: material he could recite perfectly today might become surprisingly difficult to reproduce tomorrow.
| Identity Lens | What Hermann Ebbinghaus Did |
|---|---|
| Consistency | Ebbinghaus memorized syllable lists until he could reproduce them without errors, establishing a repeatable retrieval practice routine. |
| Skills | Ebbinghaus relearned material at different intervals and measured how much time previous learning saved. His experiments provide a foundation for combining active recall and spaced repetition, revisiting forgotten relationships until retrieval becomes more reliable. |
| Discipline / Grind | Ebbinghaus tested retention after delays rather than assuming that successful initial learning guaranteed lasting memory. The goal is to gradually fade scaffolding and replace recognition with independent retrieval and transfer-appropriate processing. |
| Motivation | Ebbinghaus quantified memory through the time saved during relearning, making otherwise invisible retention measurable. Charting your own recall percentage after each closed-book redraw makes improvement visible and helps identify missing prerequisites before they undermine motivation. |
| Learning & Expertise | Ebbinghaus systematically varied retention intervals and examined the effects of repeated learning. Use the same experimental discipline to strengthen encoding and consolidation, vary retrieval cues through interleaving, and test cue-dependent retrieval by reconstructing a concept map in unfamiliar contexts. |
When Do Cognitive Artifacts Backfire? Over-Reliance and the Google Effect
Feynman's original lecture notes contain ideas he rejected while preparing his course, and his 1963 preface emphasizes discussing, thinking through and applying ideas rather than simply listening to lectures.
| Identity Lens | What Richard Feynman Did |
|---|---|
| Consistency | Feynman prepared explanations of fundamental physics rather than relying on students' access to reference material. His approach inspires a daily unaided Feynman explanation: hide the knowledge map and explain its relationships aloud to strengthen internal representations and counter the Google effect. |
| Skills | Feynman organized his lectures around foundational principles and their applications, encouraging students to reason through unfamiliar problems. Reconstructing a concept map from memory and taking a delayed test helps distinguish semantic memory from remembered learning experiences (episodic memory) and independently executable skills (procedural memory). |
| Discipline / Grind | Feynman's surviving lecture notes contain alternative explanations and rejected ideas, documenting the effort behind his finished lectures. Repeatedly explaining a concept in your own words before saving notes encourages meaningful encoding rather than passive copying and reduces the risk of digital amnesia. |
| Motivation | Feynman acknowledged that his lectures lacked sufficient student feedback and argued that solving problems could help make ideas more firmly understood. Rate your confidence before a closed-book explanation, then compare it with actual recall to expose the illusion of understanding and calibrate your working memory demands. |
| Learning & Expertise | Feynman emphasized discussing ideas, thinking through their implications and solving problems independently. Compare performance with and without an AI knowledge map to identify excessive cognitive offloading, protect long-term declarative memory and determine when external support should be gradually withdrawn. |
What Actually Explains Cognitive Artifacts: Memory, Dual Coding, Motivation, or Scaffolding?
In 1928, psychologist Alexander Luria described experiments in which children required external aids, including pictures, paper and other objects to turn difficult memory task into a structured activity. His experiments offer a concrete way to distinguish competing explanations for cognitive artifacts: external aids may extend working memory, pictures may provide additional encoding cues, and guided use may develop strategies that persist after the aids disappear.
| Identity Lens | What Alexander Luria Did |
|---|---|
| Consistency | Luria compared children's memory with and without external aids, showing how pictures and objects could support difficult recall tasks. Repeating this comparison at different memory loads helps test working-memory extension and distributed cognition rather than assuming every artifact improves learning. |
| Skills | Luria asked children to associate spoken words with pictures that did not directly depict them, encouraging meaningful connections between visual and verbal information. Comparing picture-assisted and text-only learning extends this approach to testing dual coding, Paivio's theory and Baddeley's working-memory model. |
| Discipline / Grind | Luria examined how children learned to use external signs and subsequently developed internal remembering strategies. Tracking performance with aids, during guided practice and after their removal helps distinguish Vygotskian scaffolding from persistent reliance on an extended mind. |
| Motivation | Luria observed that children differed in their ability to use external memory aids, with some needing to learn how to connect pictures and words effectively. Measuring self-efficacy before and after guided tasks helps test whether confidence contributes to performance gains within the Zone of Proximal Development. |
| Learning & Expertise | Luria investigated the transition from externally assisted remembering to internal memory strategies, examining whether learning with aids improved subsequent unaided recall. Tracking delayed transfer after gradually fading support helps distinguish temporary cognitive offloading from lasting independent learning. |
From the Astrolabe to AI: Cognitive Artifacts That Extend Working Memory
Imagine a medieval astronomer in Baghdad determining the time of the afternoon prayer. Putting the astronomical tables, geometric relationships, and intermediate calculations in his head, he measures the Sun’s altitude and adjusts the instrument until its engraved scales align. The astrolabe turns an otherwise demanding mathematical problem into a sequence of physical operations: the instrument stores the relationships, the astronomer supplies the observations, and their interaction produces an answer.
The instrument reduced working-memory demands by keeping intermediate relationships visible, supported cognitive offloading by transferring calculations into engraved geometry, and enabled distributed cognition by combining the astronomer’s observations with mathematical knowledge embedded by the instrument maker.
he same principle underlies modern AI mind maps, knowledge graphs, and advance organizers: externalizing information allows learners to devote more attention to interpreting relationships, testing assumptions, and making decisions, provided the external representation is accurate and they know how to use it.
Best AI Mind Maps for Literature Synthesis?
When German sociologist Niklas Luhmann began developing his Zettelkasten in the 1950s, he needed to curate thousands of observations, books and competing ideas and turn it into a coherent body of knowledge rather than an ever-growing archive.
| Identity Lens | What Niklas Luhmann Did |
|---|---|
| Consistency | Luhmann steadily converted his reading into individual, interconnected notes, building a research archive of approximately 90,000 cards. His practice illustrates how creating one evergreen note per paper, preserving citation management metadata and mapping semantic relationships daily can turn scattered literature into cumulative knowledge. |
| Skills | Luhmann assigned notes unique identifiers and linked related ideas across different subjects, allowing connections to emerge beyond their original reading context. Recreating this structure with bidirectional links in Zotero, Mendeley or AI mind maps develops bottom-up literature synthesis and reveals relationships between otherwise isolated papers. |
| Discipline / Grind | Luhmann developed a branching system of notes, cross-references and indexes that allowed him to revisit earlier observations and connect them with subsequent reading. Annotating and comparing papers rather than merely saving them strengthens pattern recognition, reduces working-memory demands and prevents a research archive from becoming a collection of disconnected summaries. |
| Motivation | Luhmann used his interconnected notes to develop ideas across numerous publications, demonstrating how accumulated research can become material for sustained intellectual work. Sharing an interactive concept map built from linked papers extends this principle to collaborative reasoning, allowing peers to inspect evidence, challenge connections and suggest alternative interpretations. |
| Learning & Expertise | Luhmann connected notes across topics, creating opportunities for unexpected relationships to emerge as his collection expanded. Turning these connections into testable questions develops schema formation, knowledge architecture and hypothesis generation, transforming literature consumption into original research. |
How Do AI Learning Roadmaps Accelerate Mastery?
When educational psychologist Benjamin Bloom introduced Learning for Mastery in 1968, he organized instruction into successive learning units, each followed by a formative assessment. Students who struggled received targeted corrective instruction and another opportunity to demonstrate mastery, while those who succeeded could pursue enrichment activities.
| Identity Lens | What Benjamin Bloom Did |
|---|---|
| Consistency | Bloom organized instruction into successive learning units with explicit objectives, demonstrating how a five-minute advance organizer before each MOOC, lecture or textbook chapter can establish a navigational roadmap and make daily learning more consistent. |
| Skills | Bloom emphasized the quality of instruction and students' ability to understand learning tasks, using targeted corrective activities when initial instruction proved insufficient. Activating prior knowledge and organizing prerequisites into clear learning pathways can reduce extraneous load and support progressively more complex skills. |
| Discipline / Grind | Bloom required students to address specific learning difficulties before progressing to subsequent units, preventing unmastered prerequisites from accumulating. Following a sequenced roadmap rather than skipping difficult foundations develops the discipline needed for sustained expertise. |
| Motivation | Bloom used formative assessments to identify mastered competencies, prescribed corrective activities for struggling students and offered enrichment to those ready for greater challenges. Marking demonstrated competencies on a roadmap makes progress visible and reinforces mastery learning. |
| Learning & Expertise | Bloom recommended reassessing students after corrective instruction and adjusting subsequent learning activities according to their results. Revising an AI roadmap after each formative assessment supports progressive schema construction, while gradually removing checklists and other scaffolds encourages independent performance. |
Best AI Summarizers for Long Reports? Executive Summaries That Preserve Reasoning
Winston Churchill's 1940 memorandum titled Brevity, instructing officials to write concise reports, organize essential points into short paragraphs, place complicated analysis and statistics in appendices, and use brief outlines when a full report was unnecessary. His approach preserved access to supporting evidence while making the central reasoning easier to locate.
| Identity Lens | What Winston Churchill Did |
|---|---|
| Consistency | Churchill instructed officials to organize lengthy reports into short paragraphs containing essential points, illustrating how a daily three-point executive summary can preserve a document's conceptual structure while reducing reading time. |
| Skills | Churchill separated essential conclusions from detailed analysis and statistics, placing supporting material in appendices. Comparing each summary against its original source develops document comprehension and the ability to distinguish central arguments from supporting evidence. |
| Discipline / Grind | Churchill demanded concise language and the removal of unnecessary wording while retaining access to detailed evidence. His approach illustrates why effective summarization preserves logical progression and grounded reasoning rather than collecting disconnected isolated facts. |
| Motivation | Churchill argued that shorter reports would save time and encourage clearer thinking. Measuring time saved while verifying AI summaries against their sources makes productivity gains visible without allowing hallucinations or unsupported conclusions to compromise accuracy. |
| Learning & Expertise | Churchill recommended brief outlines that could be expanded when necessary, with complex supporting material available separately. This layered approach helps manage limited context windows; checking summaries for factual accuracy, reasoning fidelity and omitted qualifications develops expertise in evidence-based synthesis. |
AI Knowledge Graphs vs Concept Maps: Which for Multi-Document Research?
Belgian information scientist Paul Otlet and his collaborator Henri La Fontaine developed the Universal Decimal Classification (UDC) to represent subjects and combinations of subjects using a common notation. By the mid-1930s, their international network had assembled approximately 18 million bibliographic records.
| Identity Lens | What Paul Otlet Did |
|---|---|
| Consistency | Otlet and La Fontaine continuously expanded their bibliographic repertory through standardized index cards and subject references, illustrating how linking three entities daily can build a cumulative knowledge graph that combines RAG, vector databases and structured citations. |
| Skills | Otlet developed the Universal Decimal Classification, extending ordinary subject categories with notation for relationships between disciplines. His approach illustrates linked thinking: connect concepts across documents, use embeddings and semantic search to discover related material, and verify those connections against their sources. |
| Discipline / Grind | Otlet organized millions of bibliographic records through common identifiers and classification rules, allowing an international network to contribute to a shared reference system. Regularly merging duplicate nodes, correcting inconsistent labels and maintaining source references prevents fragmented transactive memory and improves enterprise knowledge management. |
| Motivation | Otlet's repertory supported a remote information service through which researchers could request bibliographic information, making the practical value of organized knowledge visible. Demonstrating how graph database traversal reveals a previously hidden connection can similarly reinforce collaborative reasoning and collective intelligence. |
| Learning & Expertise | Otlet and La Fontaine expanded decimal classification into a system capable of representing combinations of subjects, demonstrating why knowledge organization must evolve as collections grow. Regularly refining ontology, taxonomy and metadata, using RDF/linked data conventions and knowledge engineering, improves retrieval accuracy and coordination across research teams. |
AI Glossaries That Unlock Comprehension? Terminology Lists for Fluency
Samuel Johnson in 1746 introduced the novel idea of including literary quotations alongside dictionary word definitions that illustrated how words were used in different contexts. He effectively combined concise definitions with contextual examples and organized them for immediate retrieval.
| Identity Lens | What Samuel Johnson Did |
|---|---|
| Consistency | Johnson systematically collected words, definitions and illustrative quotations, building a reusable vocabulary reference. Defining five unfamiliar terms daily in your own words, with contextual AI examples, creates persistent external memory and gradually strengthens disciplinary fluency. |
| Skills | Johnson distinguished multiple meanings of the same word through quotations from different authors, demonstrating why vocabulary must be understood in context. Interleaving related terms and explaining their differences develops metacognition, attentional control and more accurate conceptual understanding. |
| Discipline / Grind | Johnson spent years collecting, classifying and revising definitions, removing unnecessary material while preserving examples that clarified meaning. Before advancing through a chapter containing unfamiliar terminology, establish concise definitions and retrieval cues so vocabulary difficulties do not repeatedly interrupt comprehension. |
| Motivation | Johnson made difficult vocabulary more accessible by pairing definitions with recognizable literary examples. Repeatedly testing whether you can explain and apply unfamiliar terms provides visible evidence of progress, supporting executive function and sustained motivation through measurable vocabulary mastery. |
| Learning & Expertise | Johnson used quotations to distinguish subtle differences in meaning, demonstrating that understanding a term requires examining how it functions in different contexts. Applying elaborative interrogation, self-explanation and multimodal AI examples develops flexible retrieval and helps transfer vocabulary into authentic disciplinary reasoning. |
AI Dashboards as Cognitive Artifacts in Business, Healthcare and Engineering?
Henry Gantt developed progress charts that compared planned output with actual production over time. Instead of requiring managers to reconstruct the state of operations from lengthy reports, the charts made delays and discrepancies visible, supporting decisions about where intervention was needed. The main idea was externalize operational state, compare expectations with observations, and connect visible discrepancies to specific actions.
| Identity Lens | What Henry Gantt Did |
|---|---|
| Consistency | Gantt's progress charts compared scheduled production with actual output, making operational status visible without repeatedly reconstructing it from reports. Checking a learning analytics or clinical decision support dashboard daily extends this principle: identify one meaningful discrepancy, verify its significance and assign one action rather than merely reviewing metrics. |
| Skills | Gantt represented production commitments and completed work on a common timeline, allowing managers to identify where actual performance diverged from the plan. Annotating anomalies in a business intelligence dashboard develops the ability to distinguish genuine operational problems from ordinary variation and connect observations to possible causes. |
| Discipline / Grind | Gantt refined his charts to emphasize the relationship between time, promised output and completed work, rather than displaying every available production statistic. Removing one unused chart or misleading metric applies the same discipline to digital twins, engineering dashboards and operational monitoring, reducing visual clutter so important signals remain visible. |
| Motivation | Gantt's charts made progress against production commitments visible to the people responsible for managing the work. Sharing a documented improvement—such as a resolved bottleneck or recovered schedule—extends this feedback principle to Jira, Trello and GitHub teams, reinforcing distributed decision making through evidence rather than activity counts. |
| Learning & Expertise | Gantt's charts exposed differences between planned and actual performance, giving managers information they could use to revise schedules and production decisions. Reviewing false alarms, missed anomalies and unsuccessful interventions develops decision intelligence, improves dashboard thresholds and builds organizational memory about which signals deserve attention. |
Building a Second Brain: AI Knowledge Bases for Personal Knowledge Management?
Thomas Jefferson organized his personal library by subject, adapting Francis Bacon's categories of Memory, Reason and Imagination into 44 subdivisions. When the British destroyed the congressional library in 1814, Jefferson offered his collection as its replacement; Congress purchased 6,487 volumes in 1815.
| Identity Lens | What Thomas Jefferson Did |
|---|---|
| Consistency | Jefferson maintained literary and legal commonplace books, preserving useful passages, cases and precedents for later reference. Capturing one atomic note daily and moving it from a Zettelkasten inbox into an evergreen knowledge base applies this principle to PARA and modern personal knowledge management. |
| Skills | Jefferson organized his library by subject rather than relying on alphabetical order, creating a structure that reflected relationships between areas of knowledge. Extending this approach with bidirectional linking in Obsidian, Roam or Logseq develops semantic organization: connect related ideas across projects instead of merely filing documents into separate folders. |
| Discipline / Grind | Jefferson's legal commonplace book included an alphabetical reference list, while his extensive library required a systematic subject catalog. Processing captured notes into clear concepts, source references and actionable project material applies the same organizational discipline to enterprise AI workflows, reducing the risk that valuable information disappears into an unprocessed inbox. |
| Motivation | Jefferson's accumulated library eventually served a purpose beyond his personal reading when Congress purchased it in 1815. Resurfacing one useful note each week and demonstrating its reuse in a report, decision or agentic AI workflow makes the practical value of accumulated knowledge visible. |
| Learning & Expertise | Jefferson adapted Bacon's classification system to organize his expanding collection into 44 subject divisions. Auditing a knowledge base's taxonomy each month and combining domain-specific notes with reusable prompt engineering patterns extends this practice into digital knowledge management, allowing expertise in one field to support work in another. |
AI Flashcards That Build Long-Term Memory? Spaced Retrieval That Fades Support
Austrian science journalist Sebastian Leitner's 1972 flashcard system divided a learning box into five compartments. Learners attempted to recall each card's answer before turning it over. Correctly answered cards advanced to compartments reviewed less frequently; failed cards returned to the first compartment for more practice.
| Identity Lens | What Sebastian Leitner Did |
|---|---|
| Consistency | Leitner organized flashcards into compartments that determined when each card needed another review, making practice systematic rather than dependent on remembering what to study. Completing ten daily retrievals with an Anki-style queue extends this principle through forgetting-curve scheduling, while linking personal examples to definitions creates complementary episodic/semantic retrieval cues. |
| Skills | Leitner made successful recall the condition for advancing a card, while failed answers triggered additional practice. Tracking recall accuracy across increasingly long intervals helps identify productive desirable difficulties, distinguish genuine retention from familiarity and adjust review schedules to actual performance. |
| Discipline / Grind | Leitner required learners to attempt an answer before checking the reverse of a card; forgotten material returned to the first compartment instead of being mistaken for mastered knowledge. Applying this recall-first rule to formulas, programming concepts and even memory palace associations prevents recognition from masquerading as independent recall. |
| Motivation | Leitner's compartments made progress visible: cards advanced only after successful retrieval, and familiar material gradually required less frequent attention. Tracking sustained recall accuracy, rather than simply counting completed reviews, provides measurable feedback; explaining an answer before revealing it also strengthens generative learning. |
| Learning & Expertise | Leitner's system adjusted repetition according to retrieval success, concentrating practice on cards that remained difficult. Rewriting repeatedly failed cards with clearer retrieval cues, then testing concepts through unfamiliar problems and realistic applications, extends his method toward transfer-appropriate processing and reduces dependence on the original flashcard wording. |
The Astrolabe Never Crossed the Ocean
The astrolabe transformed a bewildering sky into something that could be measured, compared, and understood. Well-designed external tools reduce unnecessary mental effort, expose relationships that working memory struggles to maintain, and allow people to spend more of their cognitive resources on reasoning, problem solving, and understanding. But every powerful tool creates a new design question. Should a cognitive artifact remain a permanent part of our thinking, as Norman and Hutchins suggest, or should it gradually disappear as learners build their own internal knowledge structures, as Vygotsky's scaffolding implies?
Modern AI makes this distinction more important than ever. We can now generate summaries, knowledge graphs, semantic maps, glossaries, and personalized learning pathways in seconds. Durable learning still depends on retrieval practice, elaboration, spacing, transfer, and the gradual construction of robust mental models that survive when the screen is switched off.
If removing the tool means the thinking disappears, it was doing too much.
If removing the tool reveals that better thinking remains, then it has done exactly enough.
After all, history remembers the explorers who crossed the ocean—not the astrolabe that quietly pointed them in the right direction.