What Is the Picture Superiority Effect? Why Images Beat Words for Memory
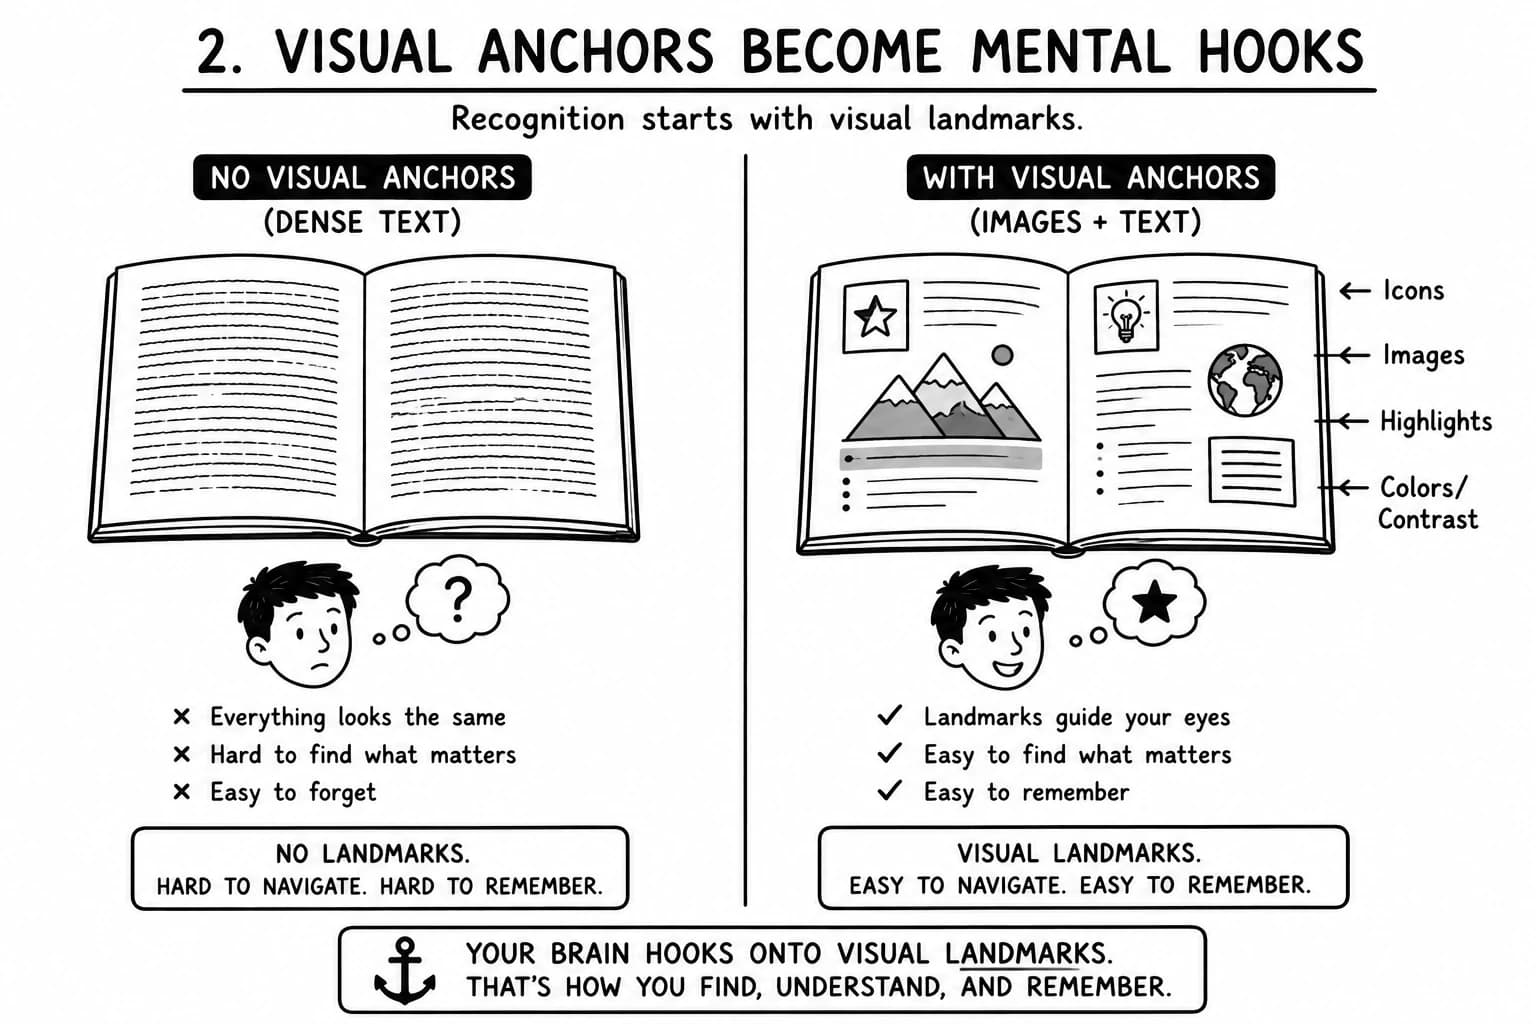
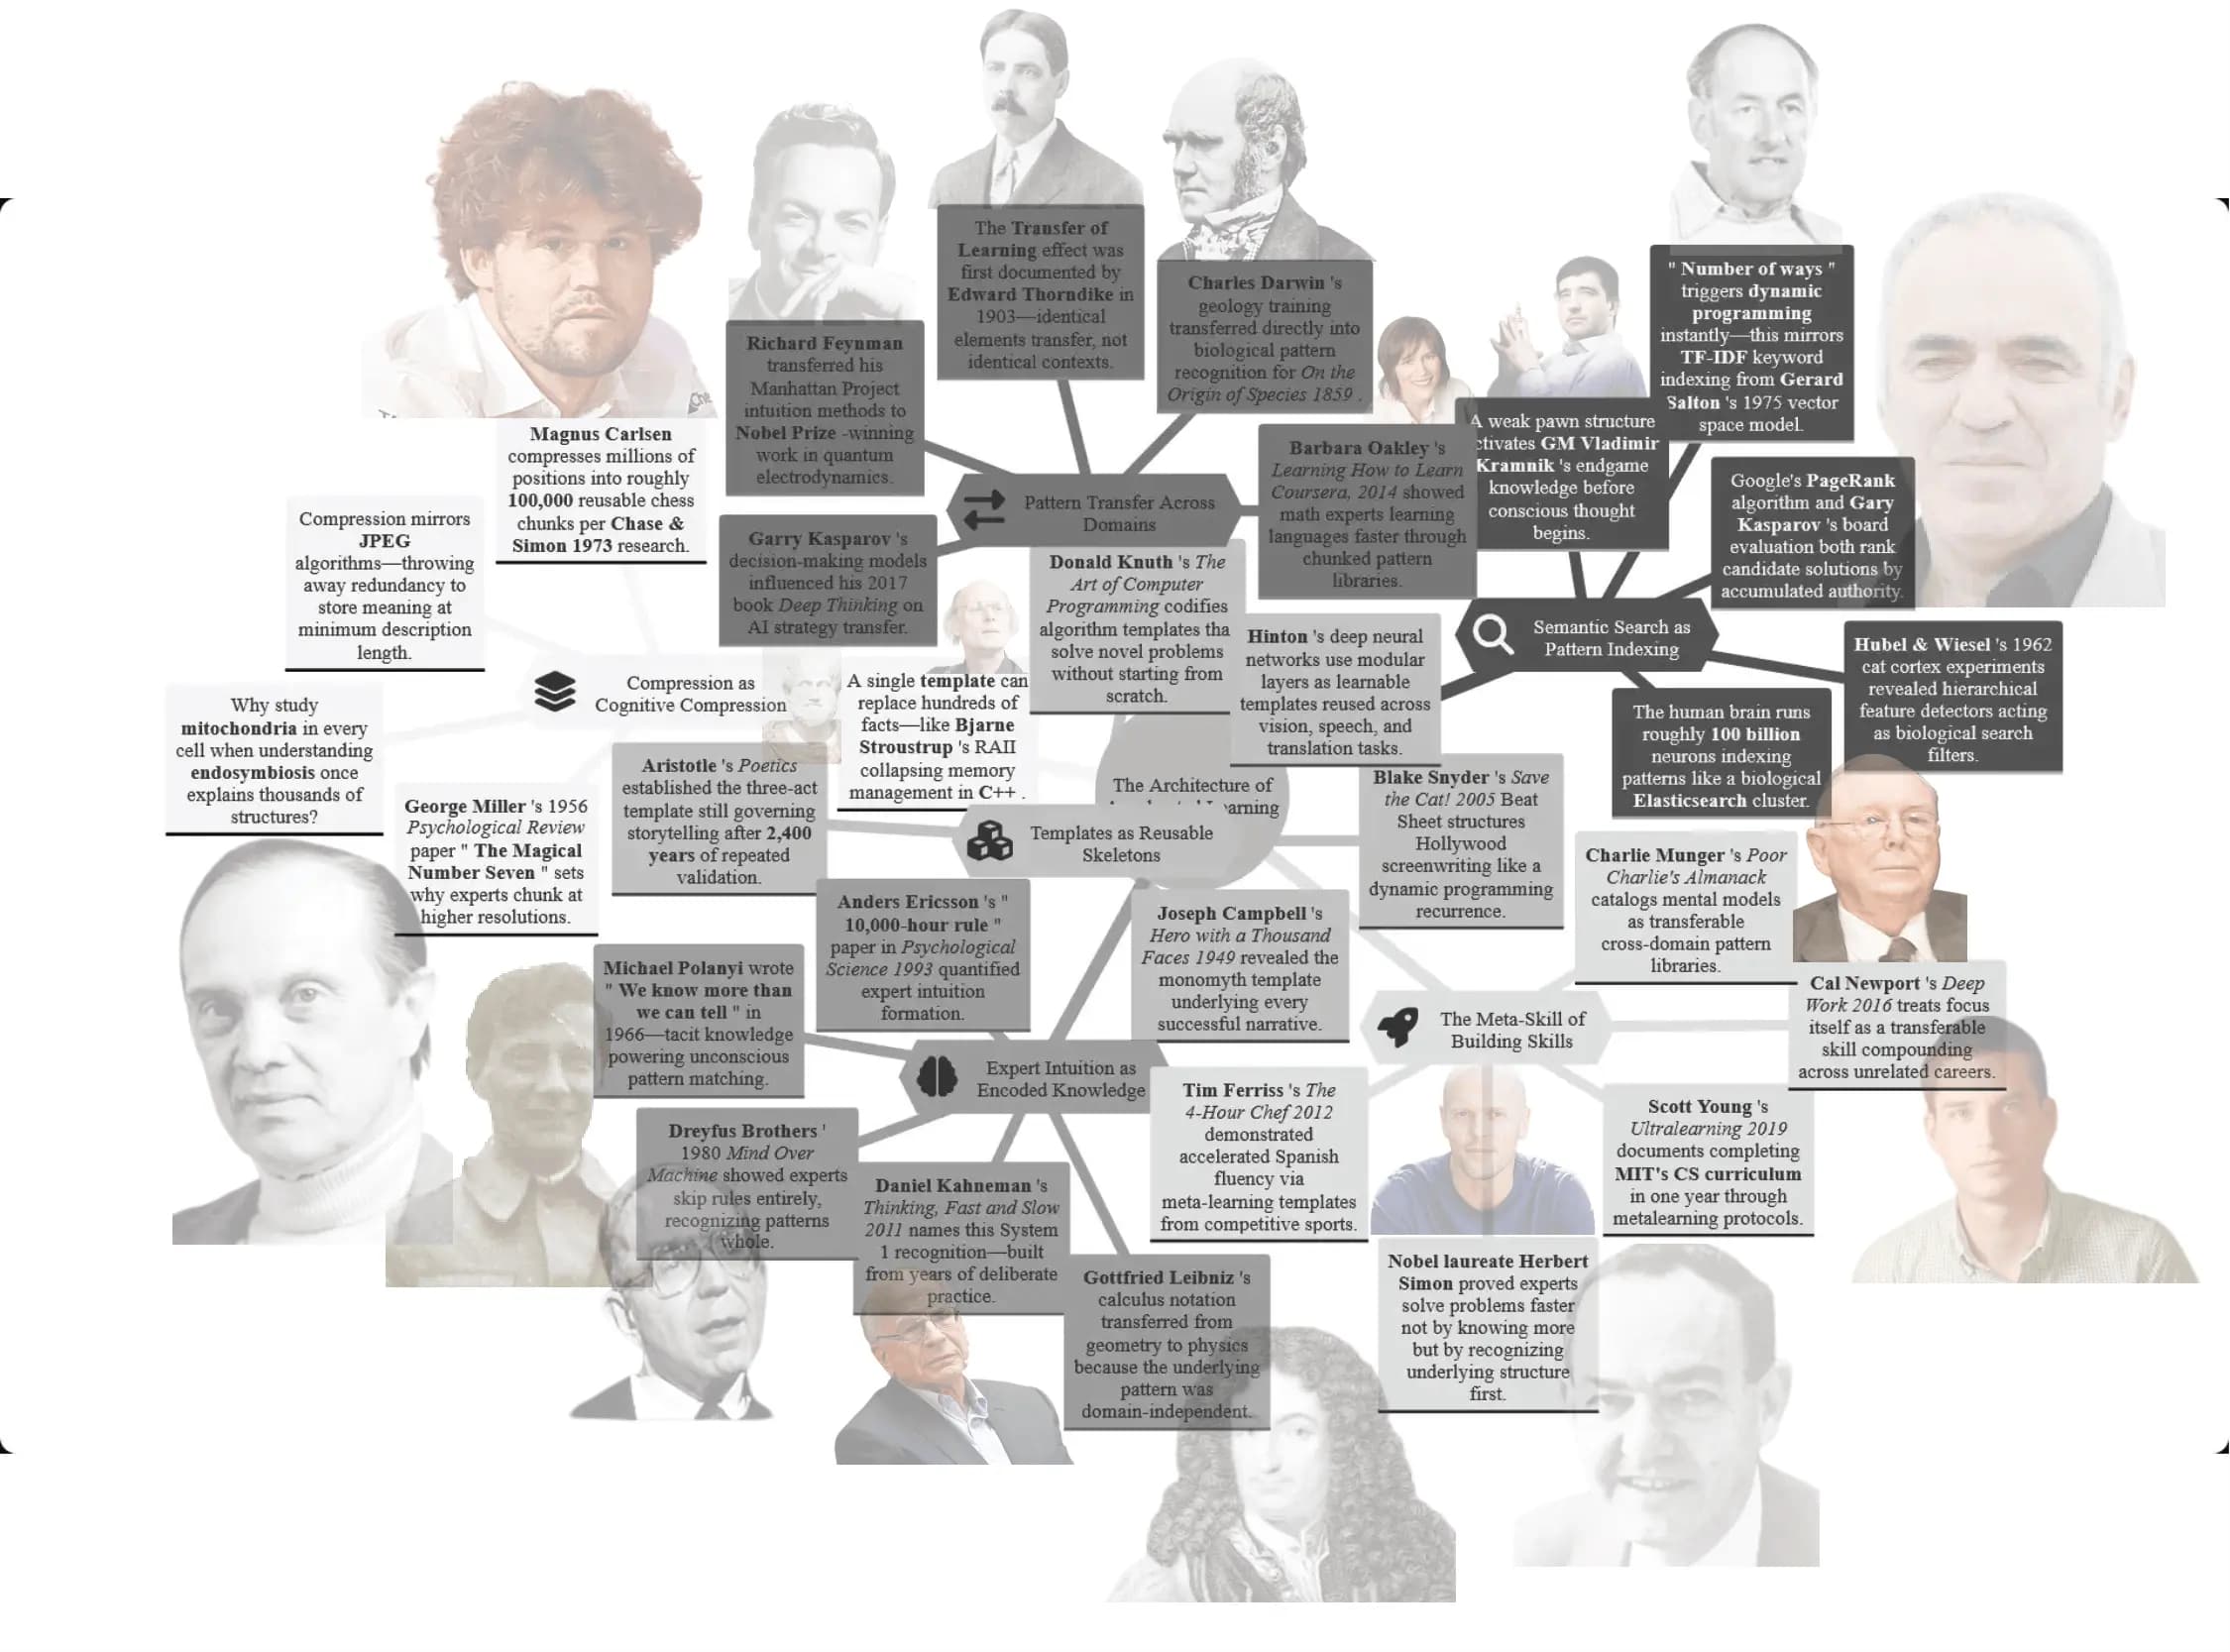
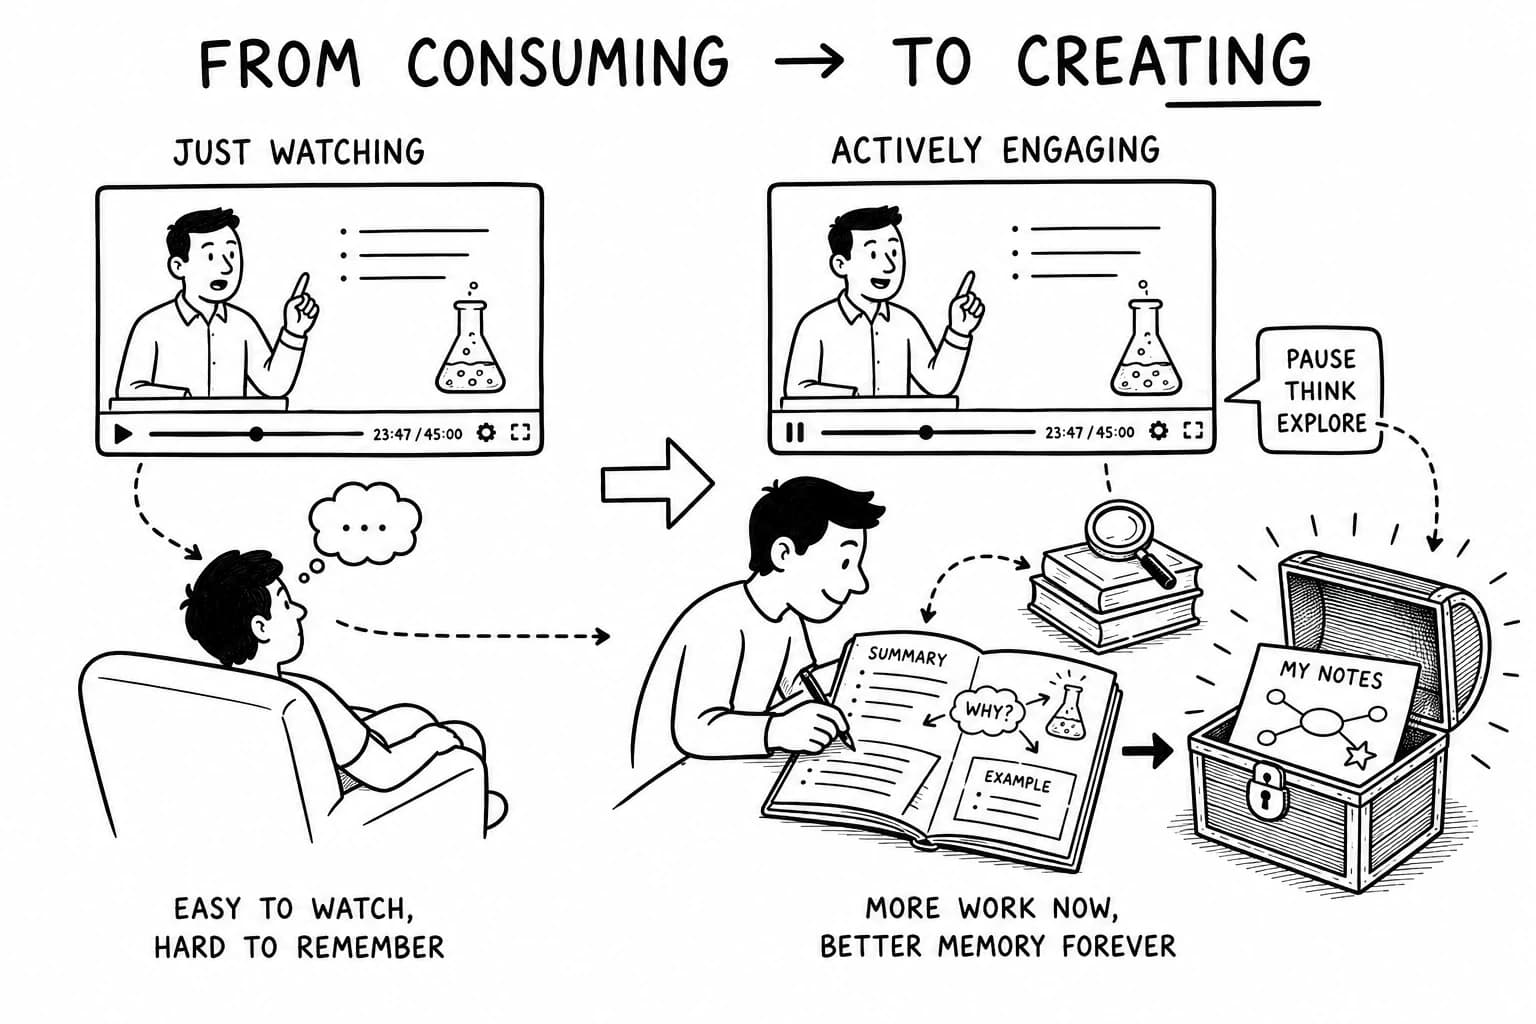
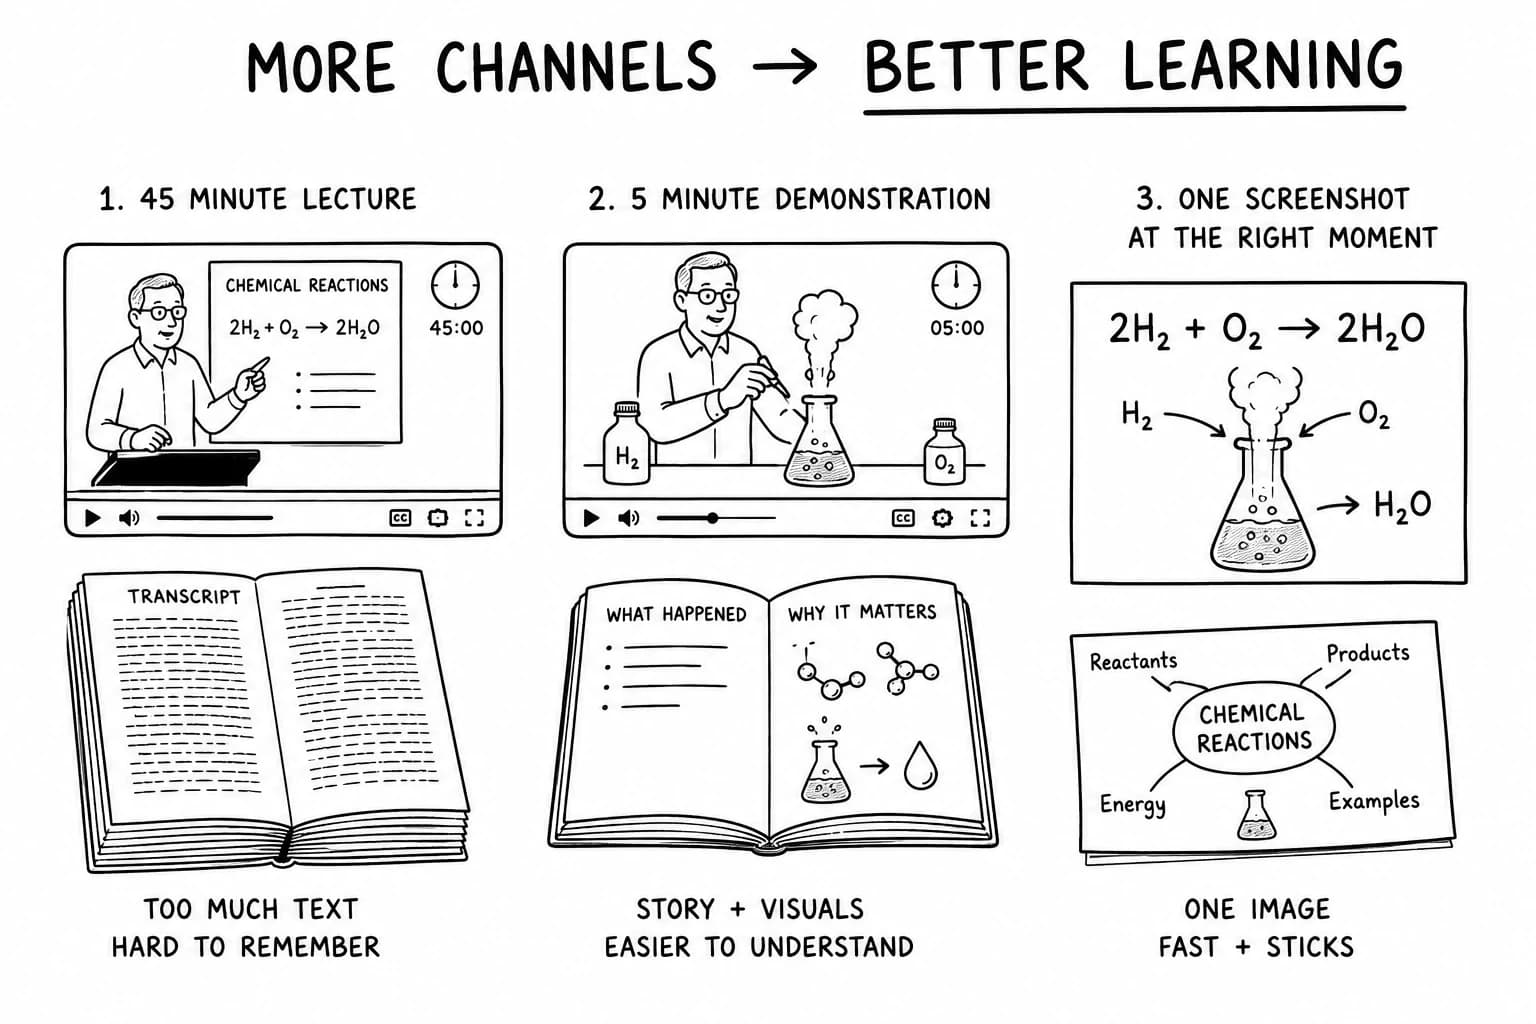
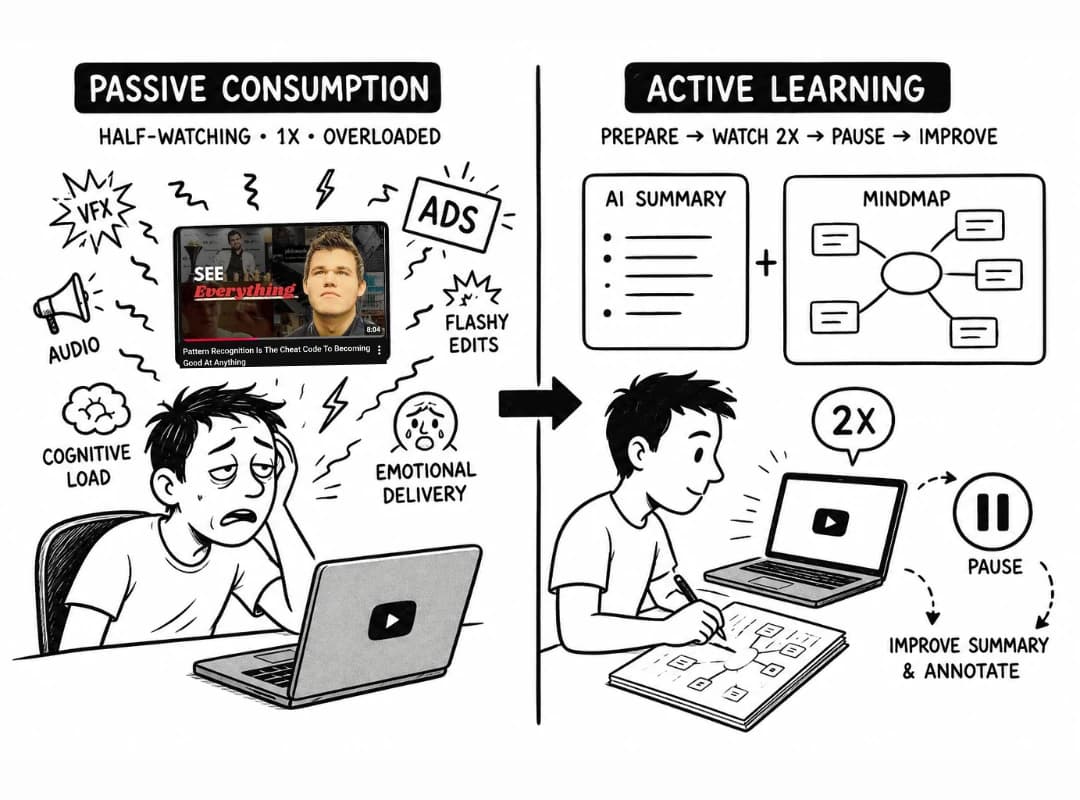
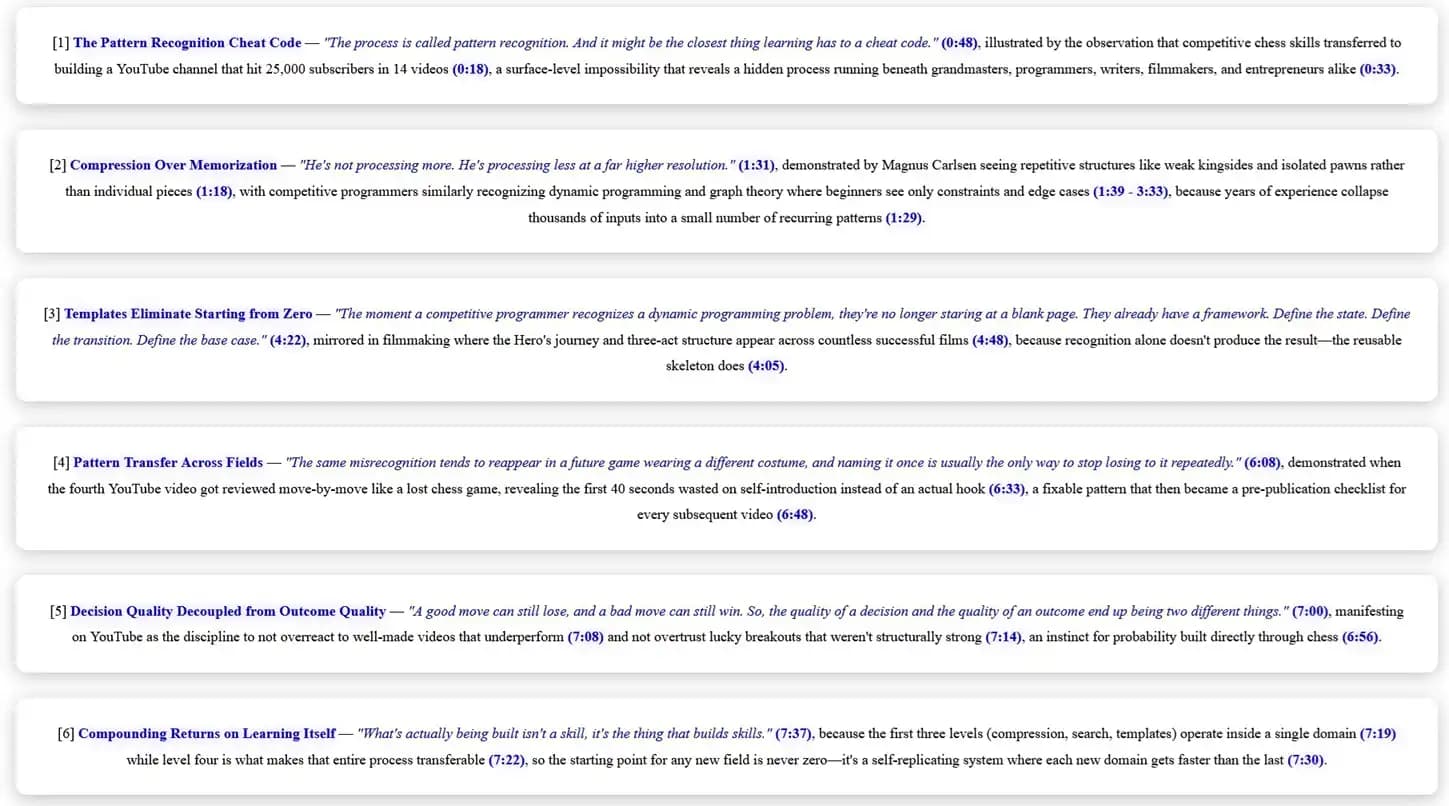
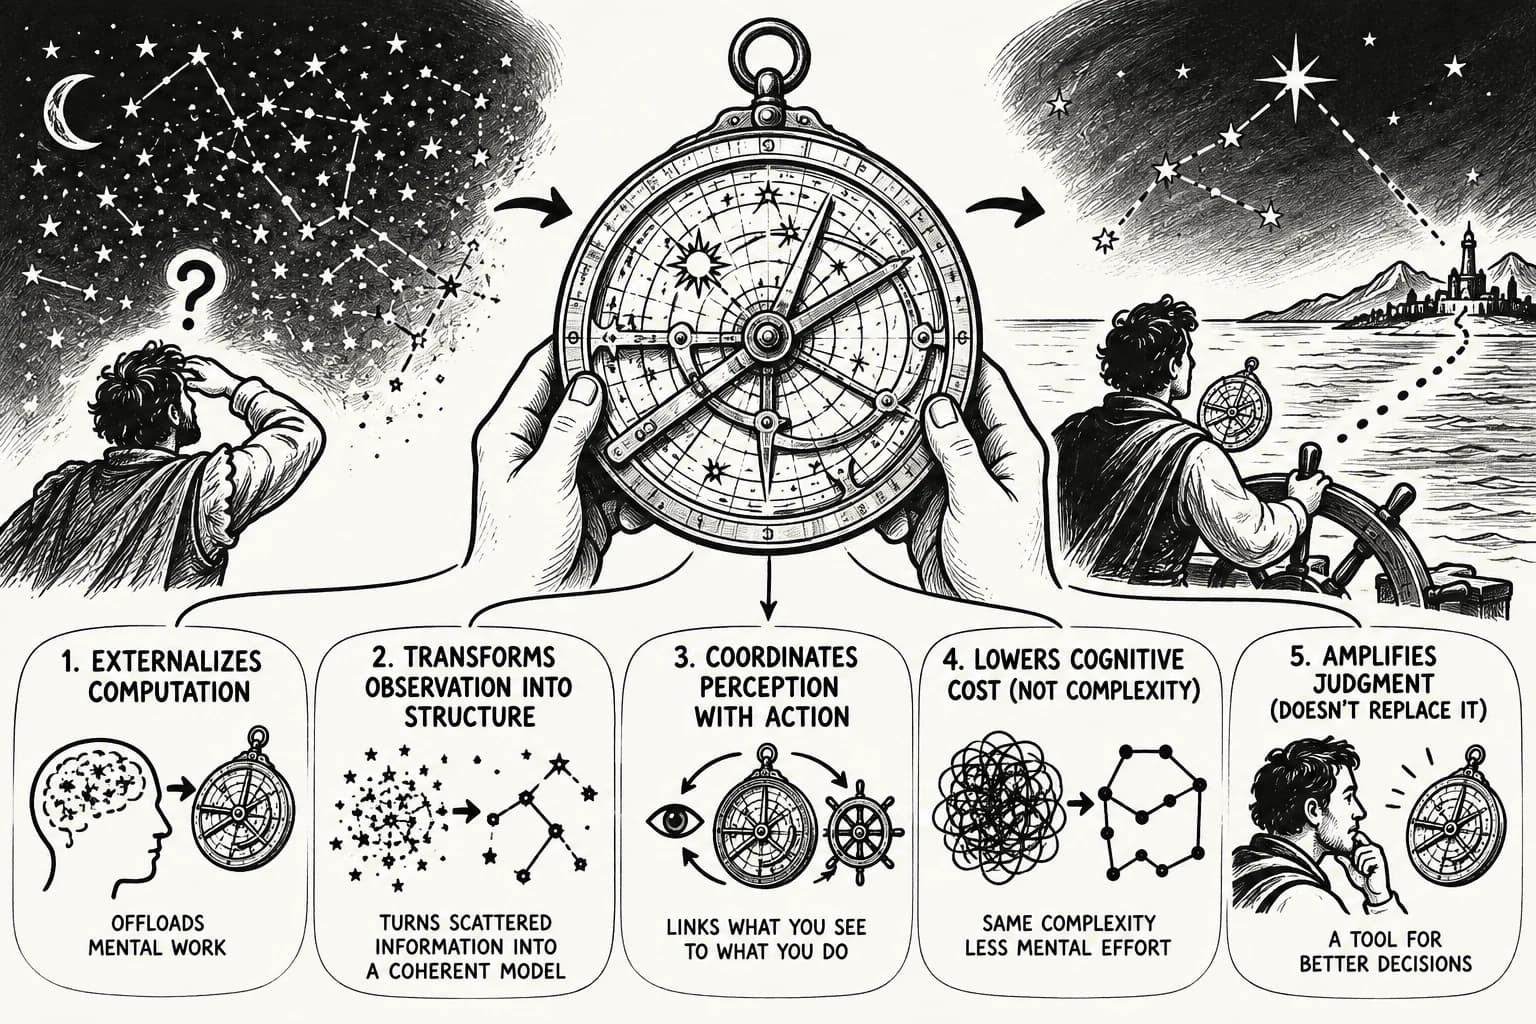
Long before merchants counted grain with clay tablets or scribes filled libraries with written records, miners searching for ore learned to read mountains by sight. A streak of quartz, a change in rock color, or the angle of a fault carried more value than pages of description because survival depended on recognizing visual patterns instantly. Human memory appears to have evolved with the same preference. The picture superiority effect (PSE) is one of the most replicated findings in cognitive psychology and memory research, showing that pictures are remembered better than words across free recall, cued recall, and recognition memory. The advantage extends from childhood through older adulthood, providing a foundation for visual learning, multimedia learning, educational psychology, instructional design, AI-generated mind maps, and knowledge visualization. Meaningful images create richer memory encoding, stronger semantic representations, and more retrieval pathways, making visual representations powerful tools for knowledge retention, conceptual understanding, and learning transfer.
Key ideas behind the Picture Superiority Effect
- Pictures outperform words because they create richer memory encoding, stronger recognition memory, free recall, cued recall, and more durable long-term memory than text presented alone.
- Dual Coding Theory, sensory-semantic theory, and transfer-appropriate processing explain why visual learning, semantic encoding, elaborative encoding, and multimedia learning consistently improve knowledge retention.
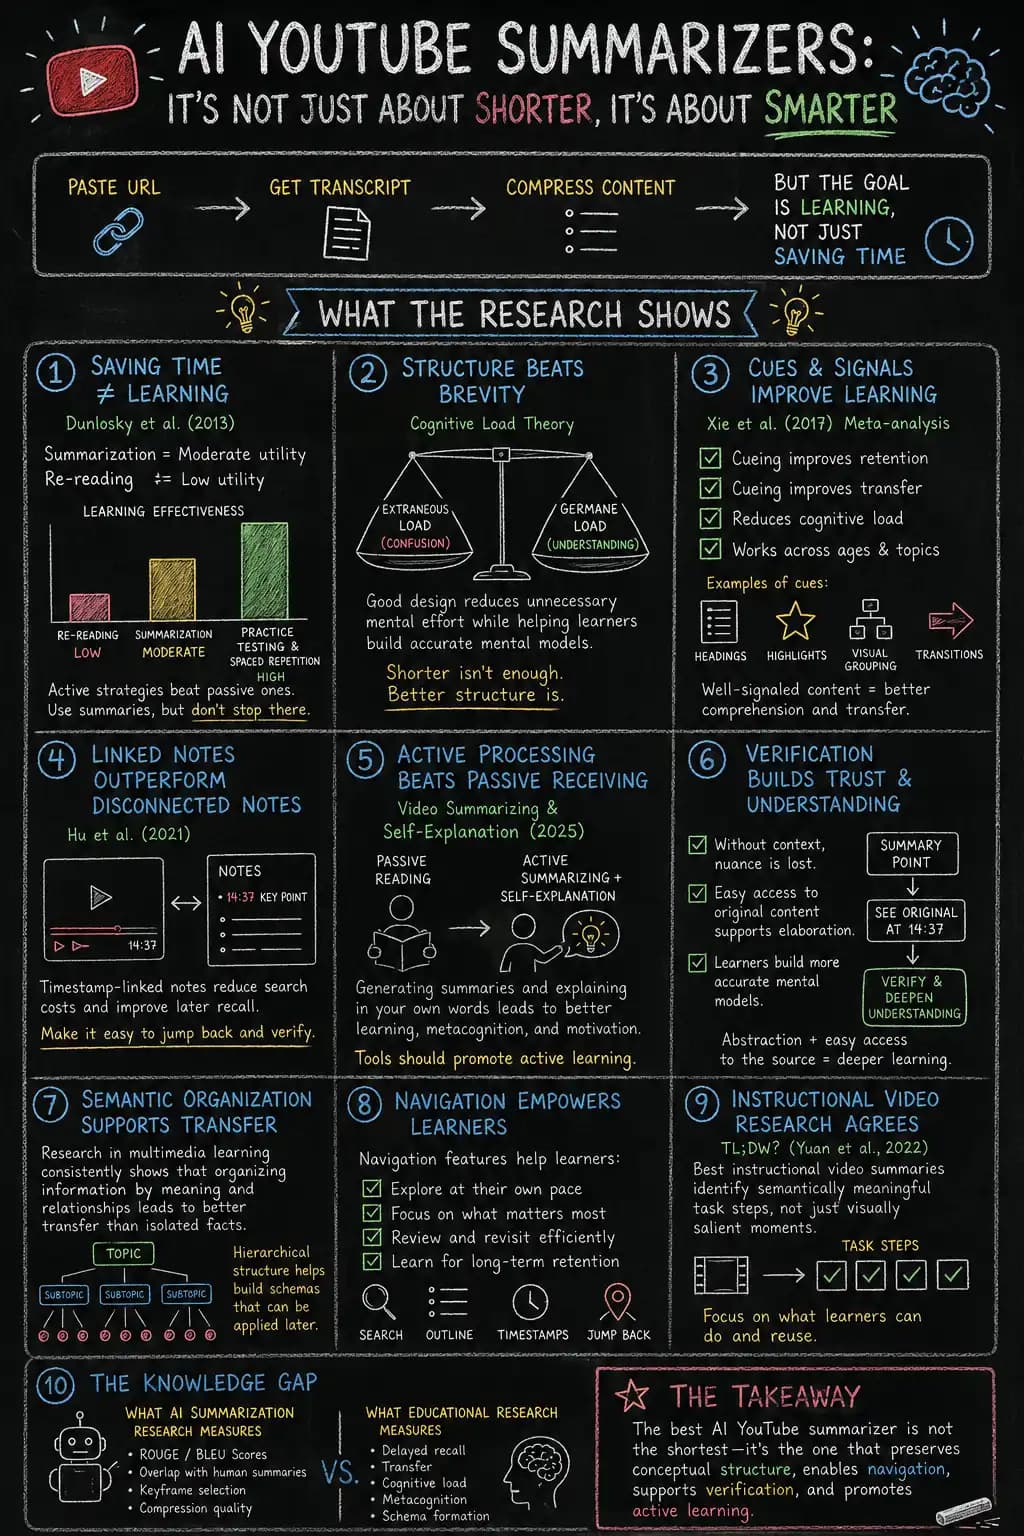
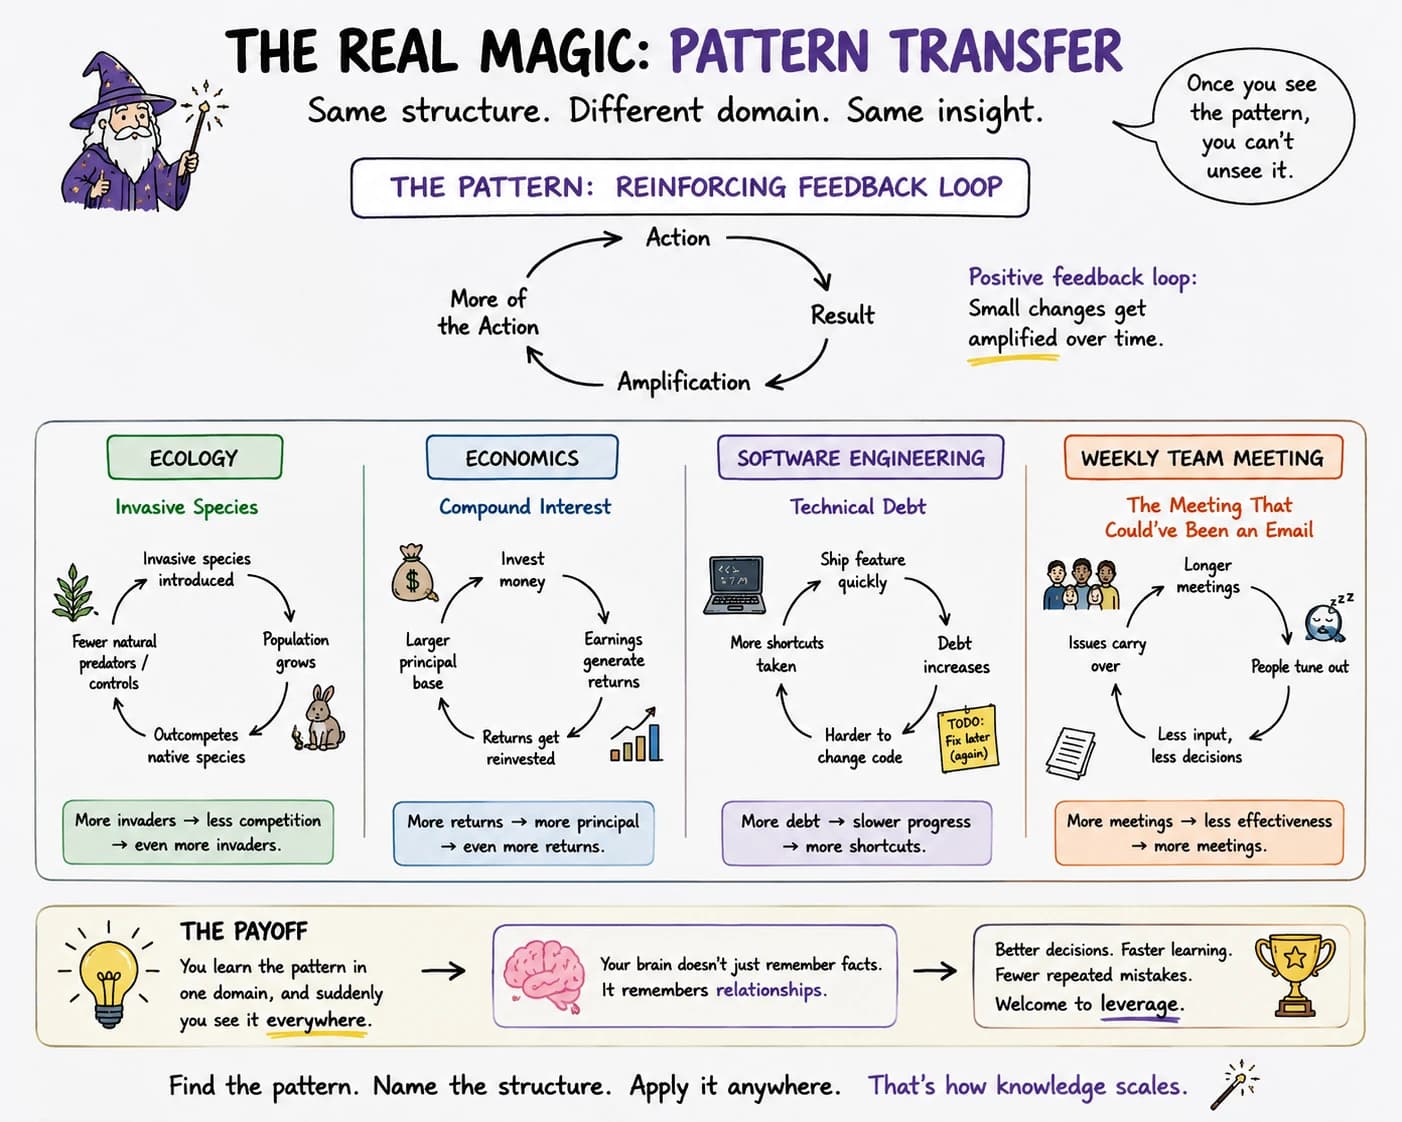
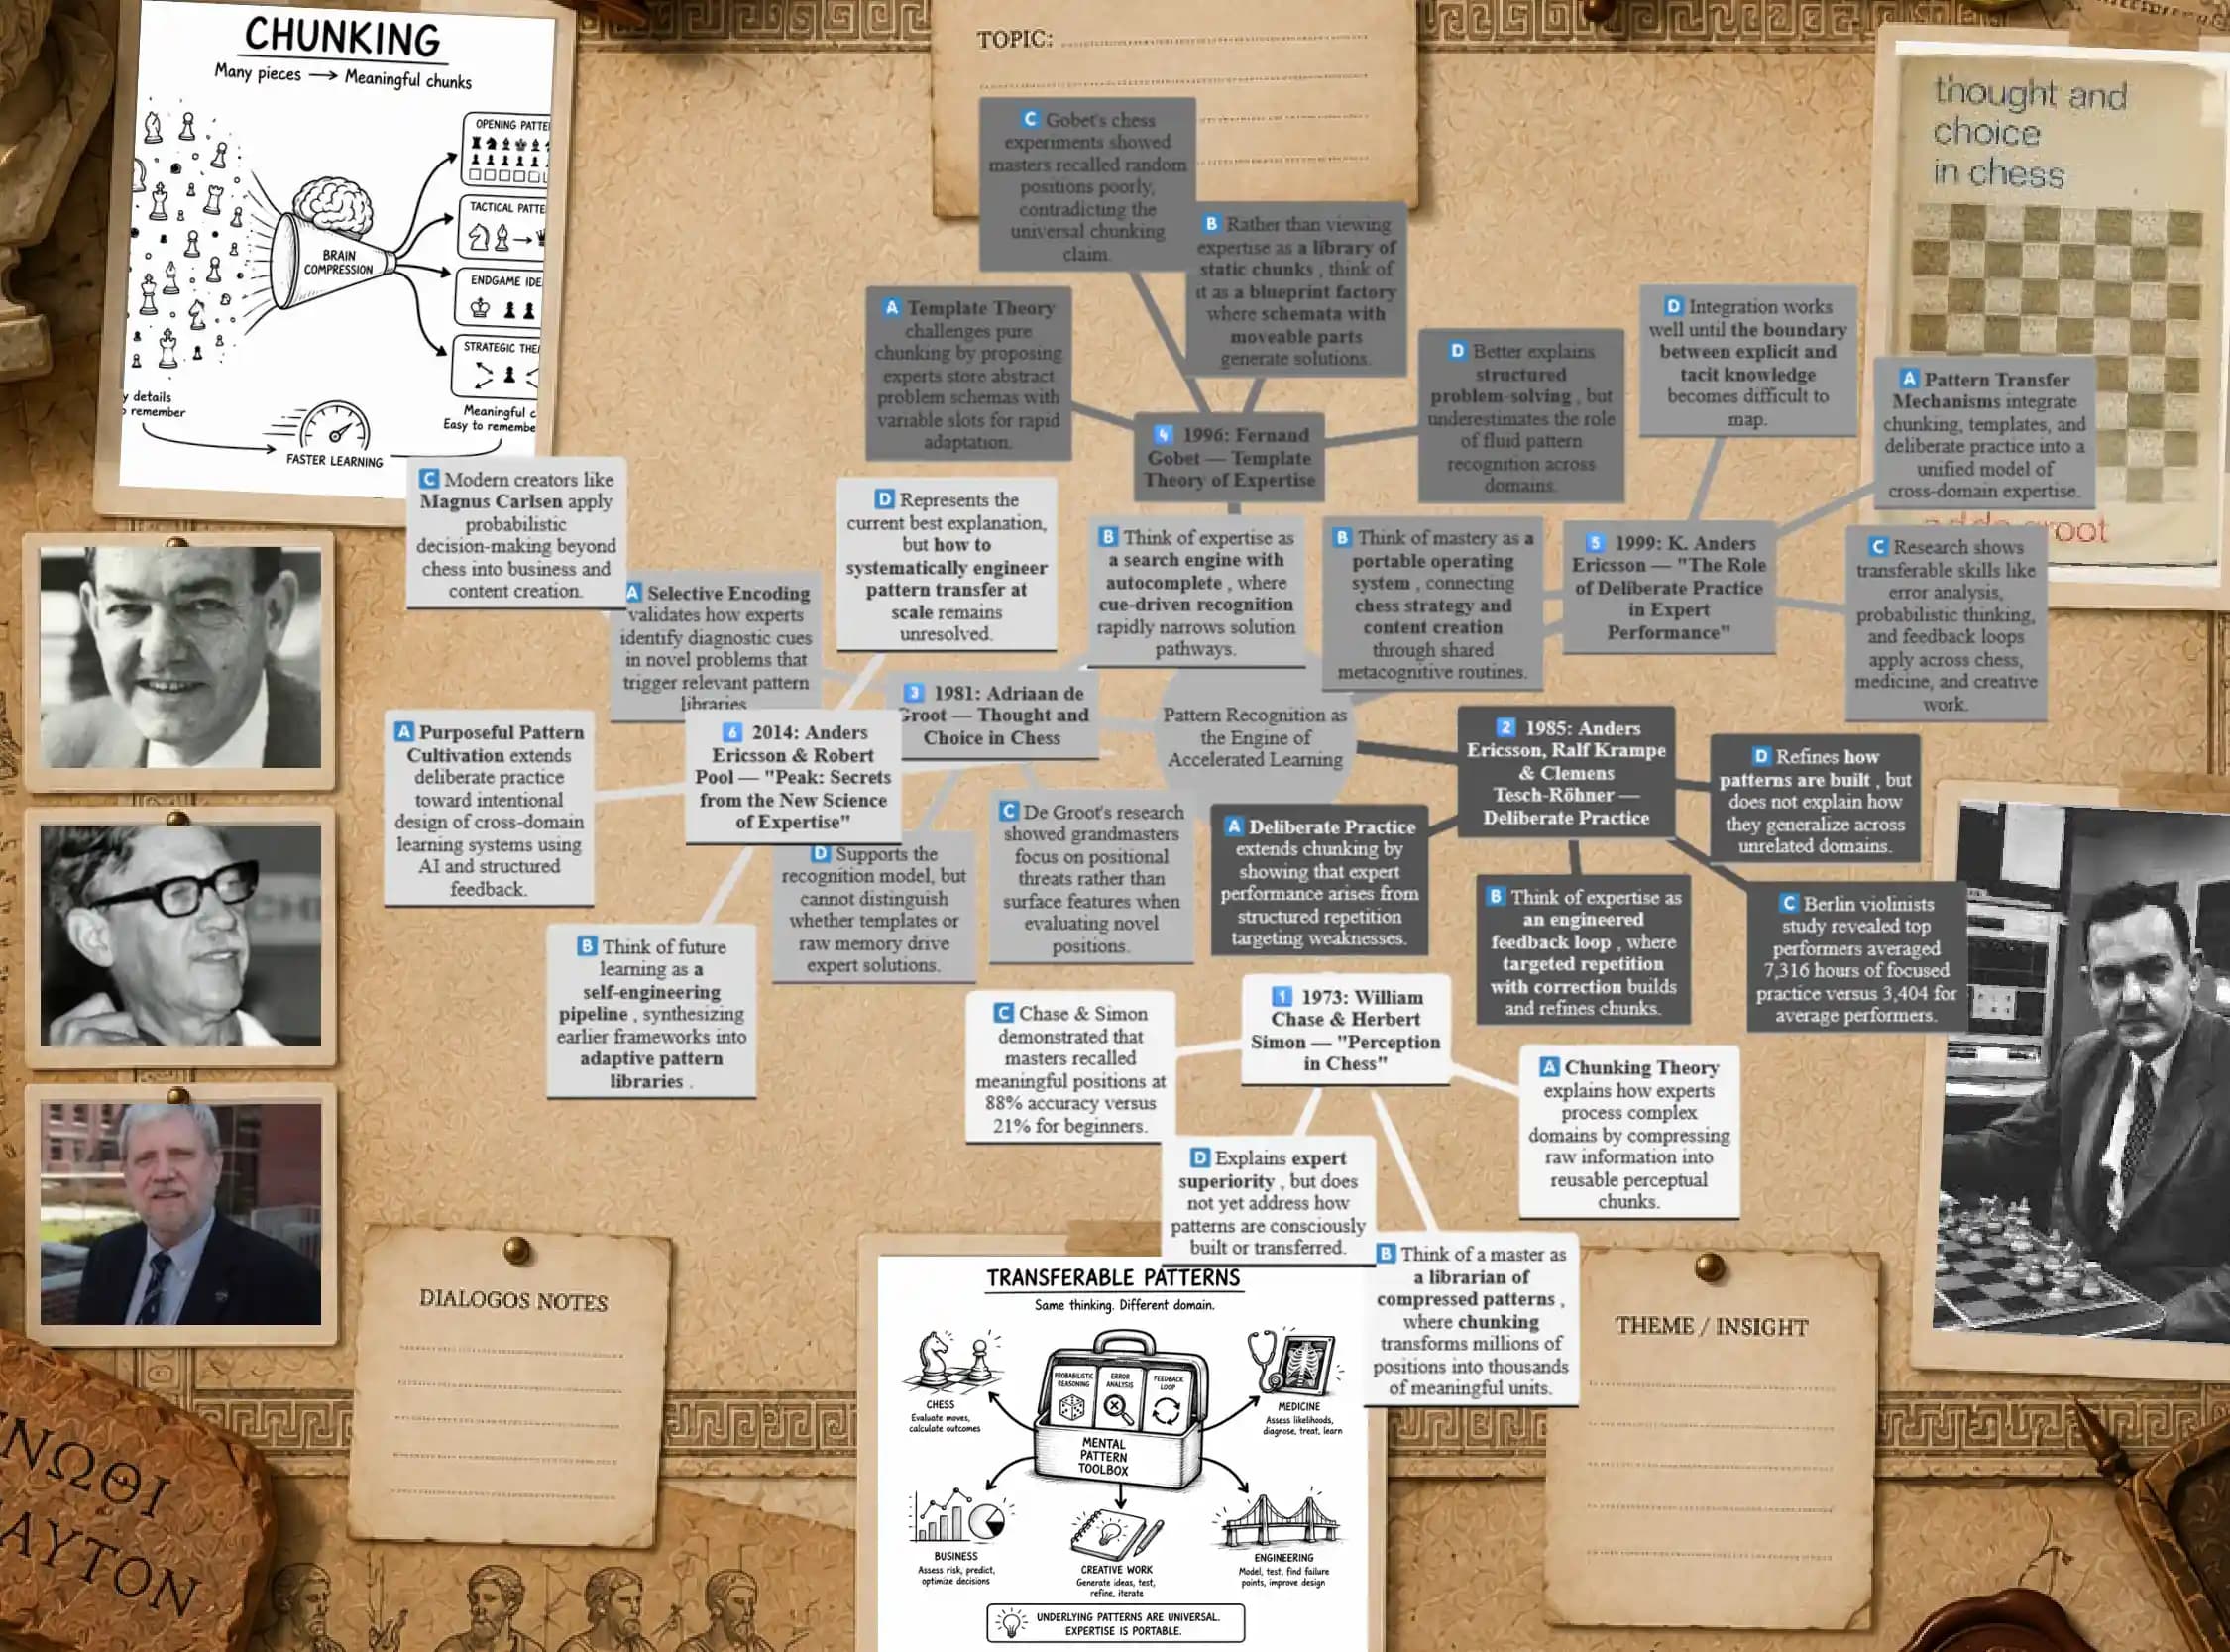
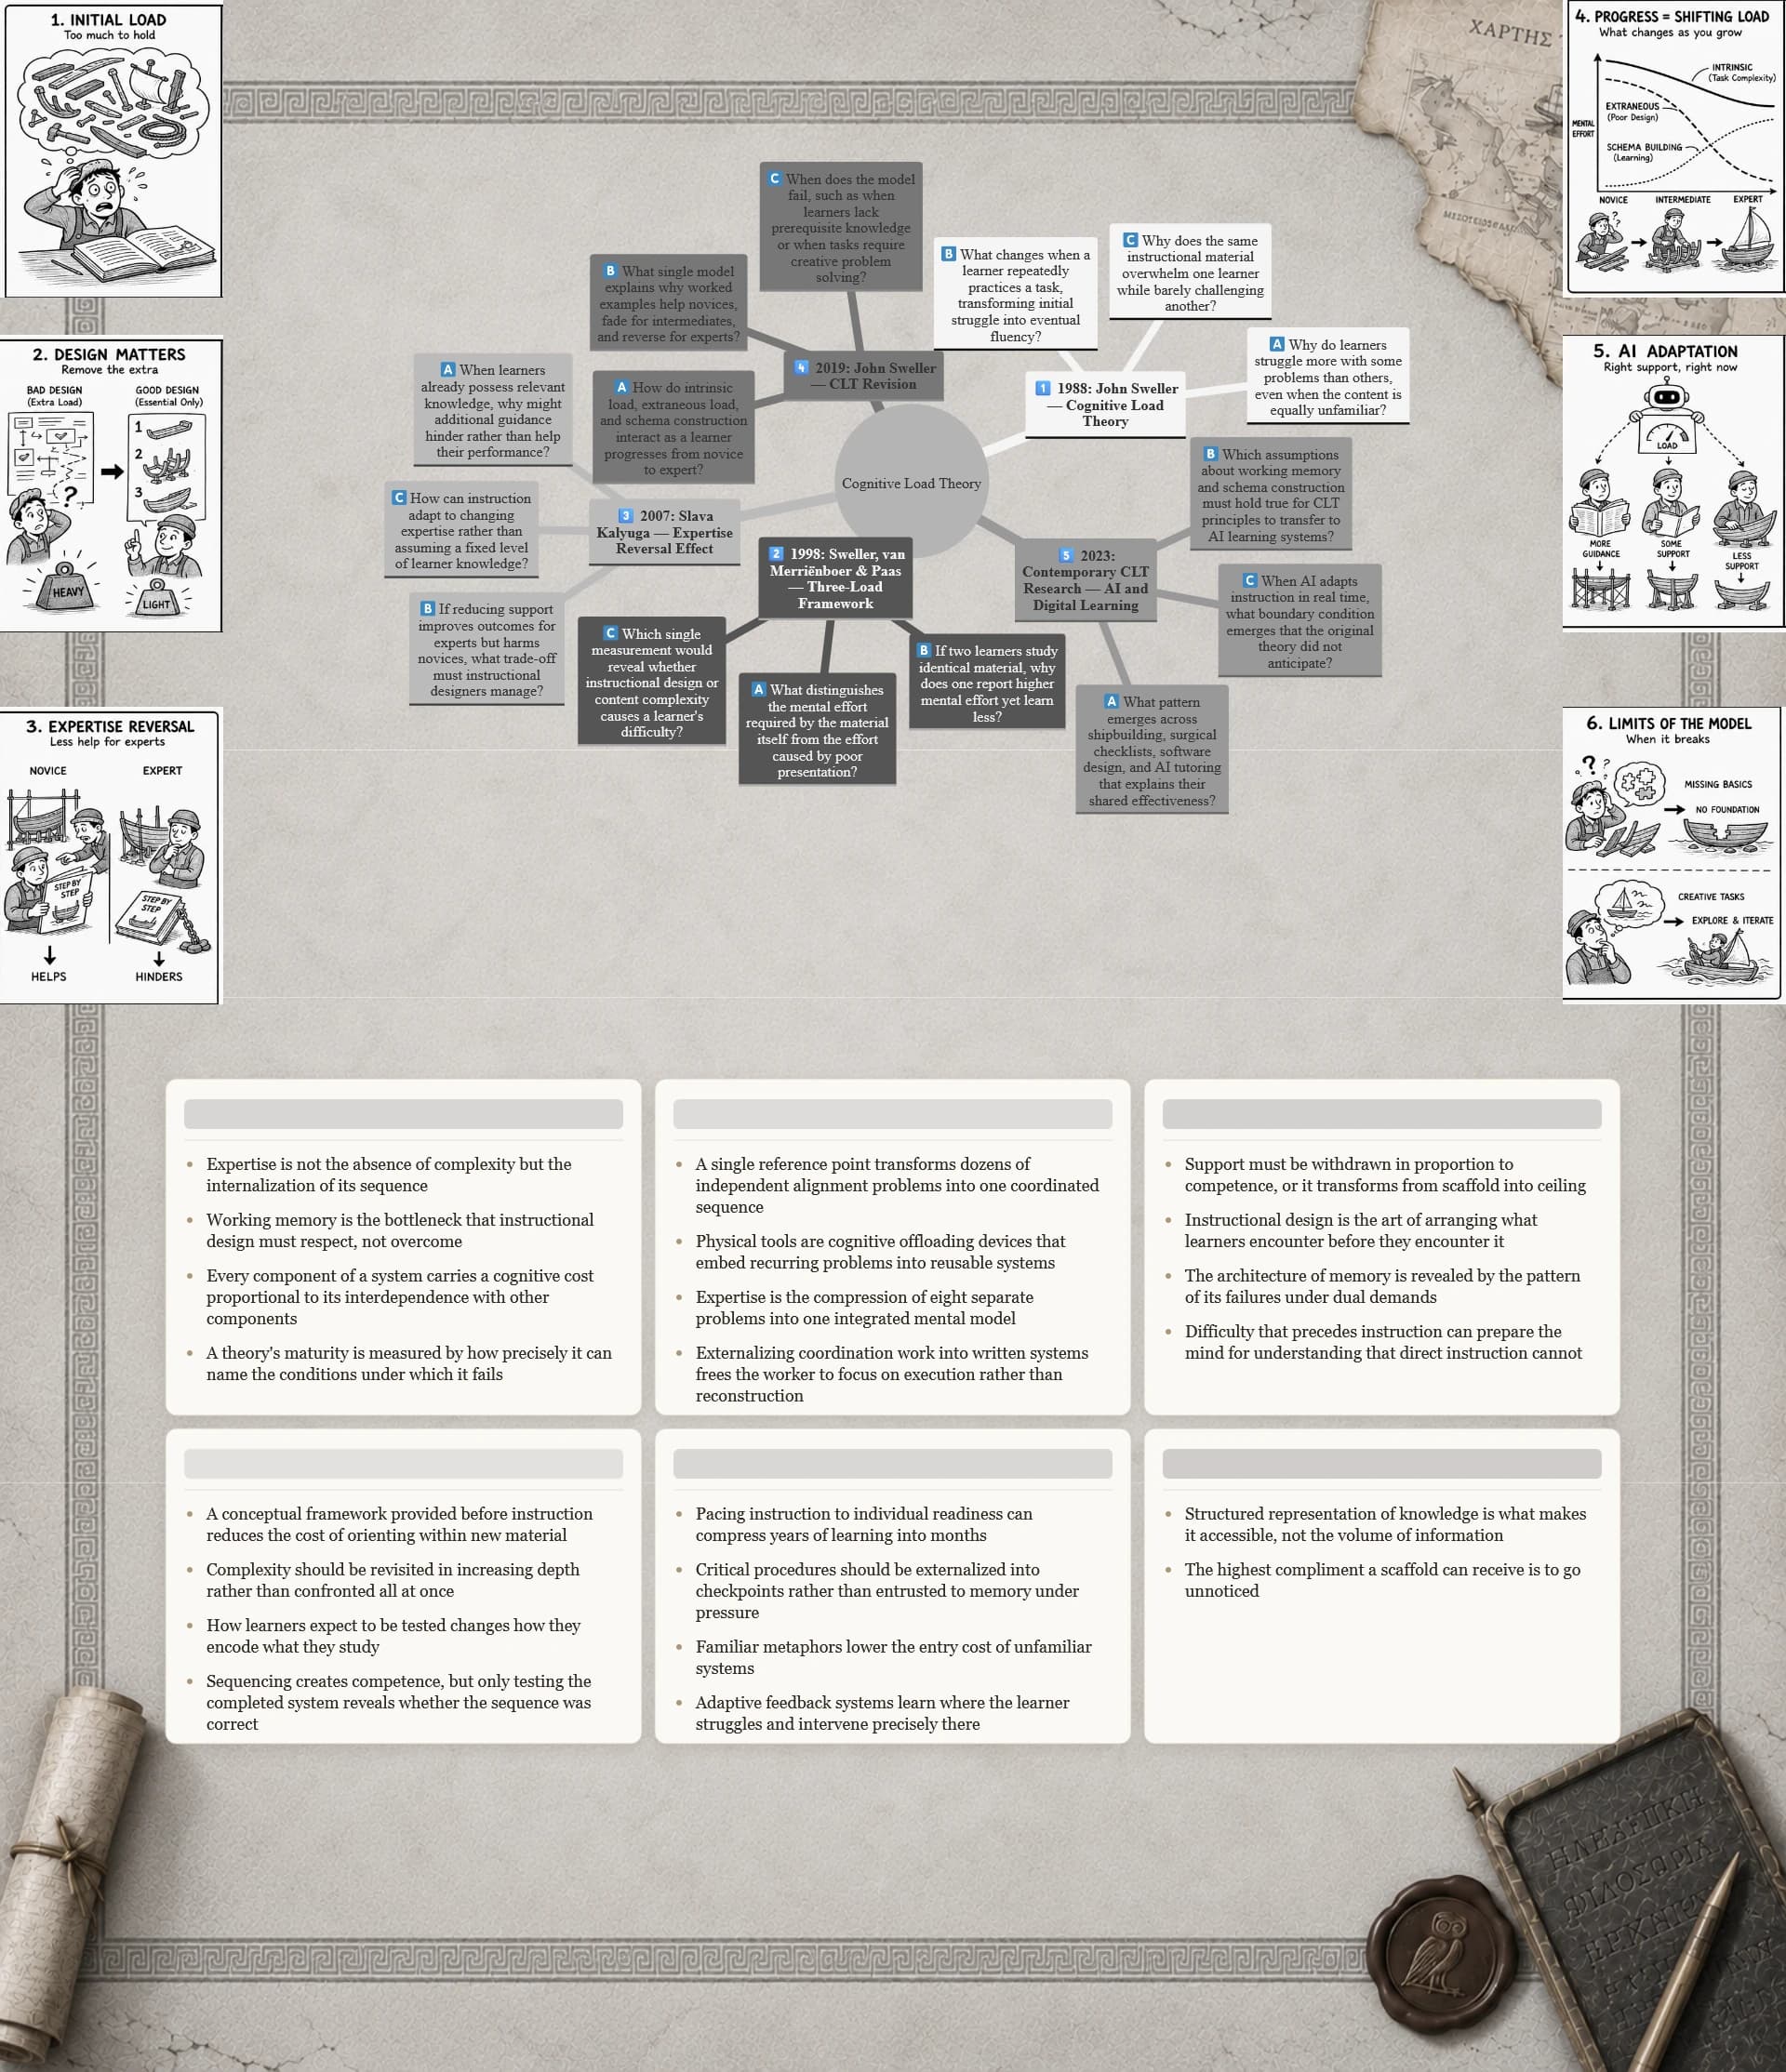
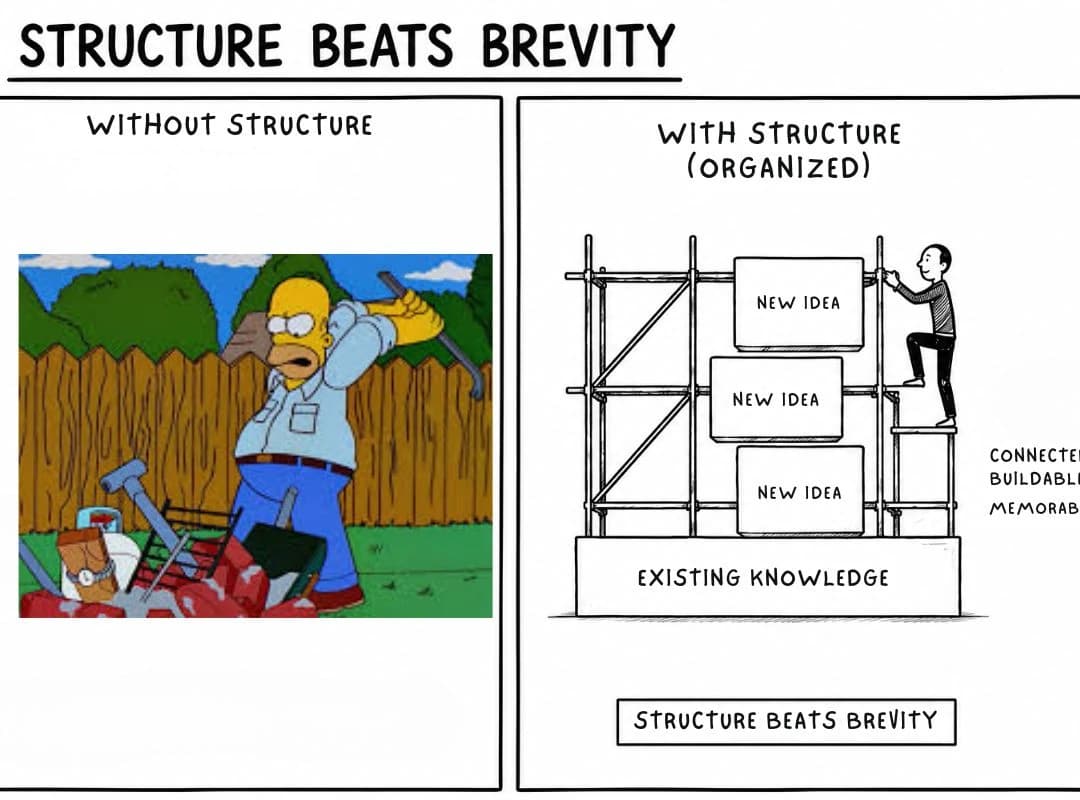
- Meaningful mind maps, concept maps, knowledge graphs, diagrams, and instructional graphics strengthen conceptual understanding because visual structure and verbal labels create complementary retrieval routes.
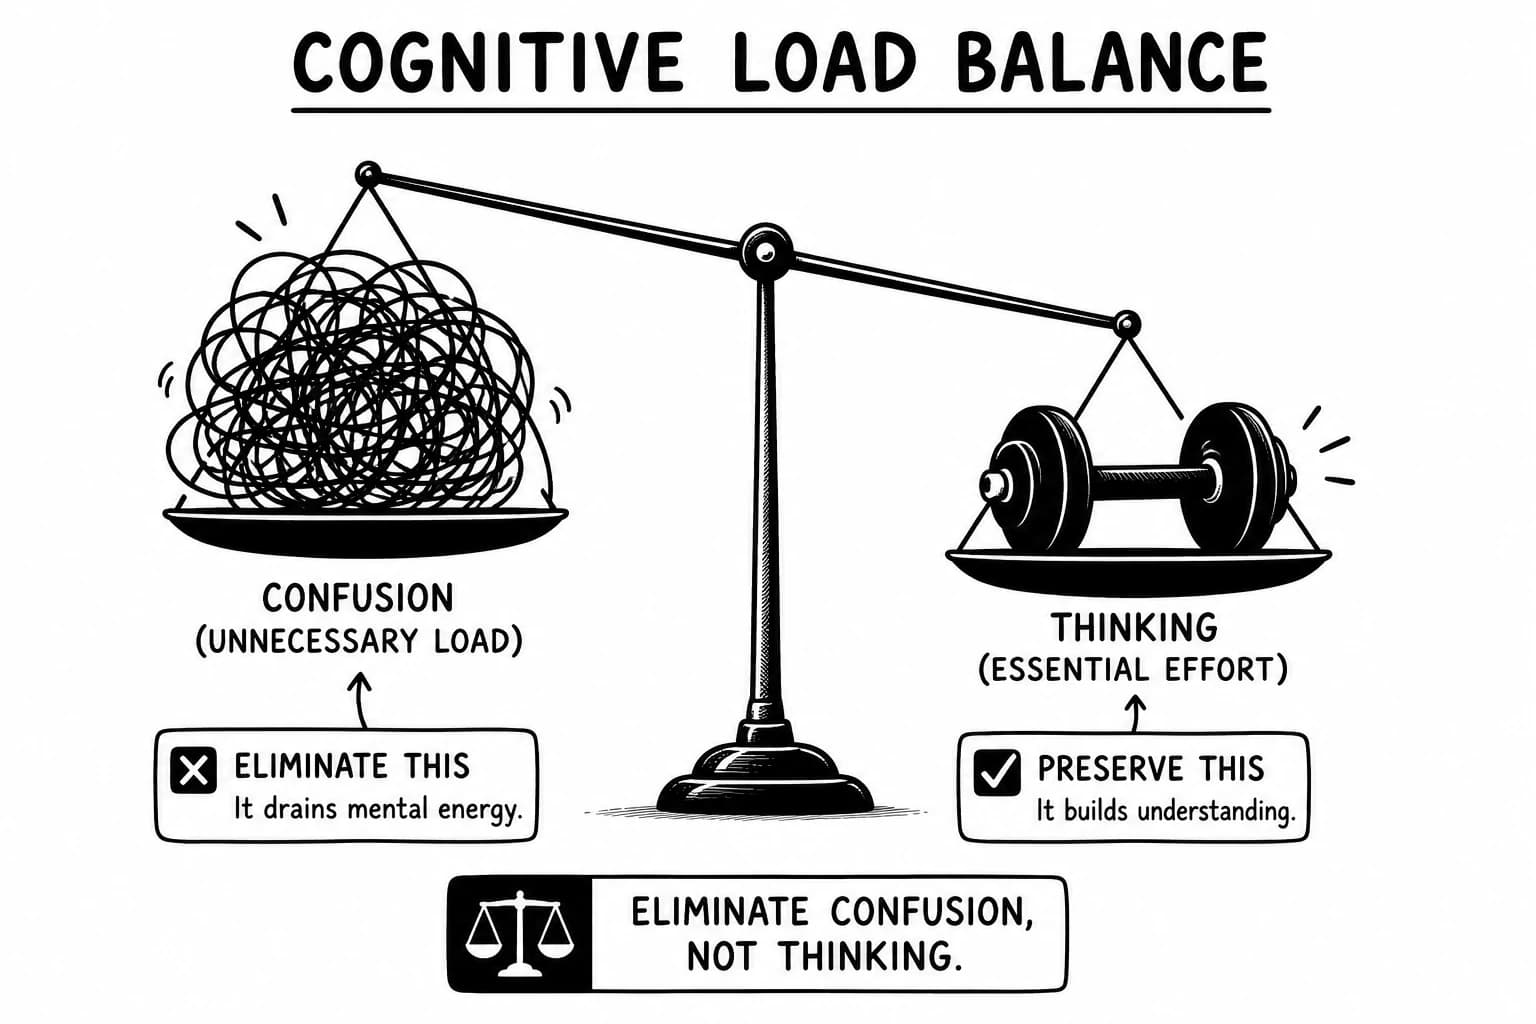
- Decorative graphics rarely improve learning. Research in educational psychology, instructional design, and Mayer's Multimedia Learning Theory shows that visuals support memory only when they contribute directly to understanding.
- The effect weakens when images become visually similar, overly complex, or disconnected from meaning, making visual distinctiveness, semantic relevance, and instructional coherence central principles for AI learning tools and educational technology.
Historical Development of the Picture Superiority Effect
| Year | Research Milestone | Contribution to Picture Superiority Research |
|---|---|---|
| 1962 | Asch & Ebenholtz | Early evidence that picture-word memory differences exist, laying groundwork for later picture superiority effect research. |
| 1967 | Shepard | Demonstrated a large recognition memory advantage for pictures over words (approximately d ≈ 1.5), establishing one of the strongest findings in visual memory research. |
| 1967 | Jenkins, Neale & Deno | Showed that different forms of representation produce different memory encoding outcomes, supporting the emerging picture superiority effect. |
| 1971 | Allan Paivio – Dual Coding Theory | Proposed that pictures generate both visual and verbal memory codes, providing the dominant theoretical explanation for why images improve memory. |
| 1973 | Standing | Demonstrated remarkable recognition memory capacity, with participants recognizing approximately 73% of 10,000 pictures, highlighting the scale of visual long-term memory. |
| 1973 | Paivio & Csapo | Showed pictures outperform words in free recall, linking dual coding, semantic encoding, and meaningful learning. |
| 1976–1977 | Nelson, Reed & Walling / Nelson, Reed & McEvoy | Developed the sensory-semantic theory, arguing that perceptual distinctiveness and direct semantic access jointly explain picture superiority. |
| 1982 | Levin & Lentz | Demonstrated that only instructional images serving a clear cognitive purpose improve learning outcomes, influencing modern instructional design. |
| 1985–2002 | Kulhavy, Lee & Caterino; Verdi & Kulhavy | Found that combining maps, text, and spatial organization improves knowledge retention, conceptual learning, and multimedia instruction. |
| 1987 | Snodgrass & McCullough | Showed that the picture superiority effect shrinks when images lack visual distinctiveness, defining an important boundary condition. |
| 1987 | Weldon & Roediger | Applied transfer-appropriate processing, demonstrating that retrieval success depends on matching encoding operations with assessment demands. |
| 2002 | Carney & Levin | Synthesized decades of research on instructional illustrations, identifying which visual strategies consistently improve education and memory. |
| 2008–2011 | Hockley; Hockley & Bancroft; Curran & Doyle | Extended picture superiority to associative memory, semantic access, and ERP evidence distinguishing recollection from familiarity. |
| 2009 | Richard Mayer – Multimedia Learning | Integrated picture superiority, dual coding, and the coherence principle, showing that meaningful visuals enhance learning while decorative graphics increase extraneous cognitive load. |
| 2008–2012 | Ally et al.; Carpenter & Olson | Explored aging, foreign-language learning, confidence biases, and boundary conditions, refining when the picture superiority effect strengthens or disappears. |
How Much Do Pictures Improve Memory? Effect Sizes and Evidence
Like a Renaissance anatomist who transformed medicine by pairing precise illustrations with careful observation, the picture superiority effect shows that meaningful visual representations consistently outperform words alone for memory encoding, knowledge retention, and long-term learning. Across decades of memory research, the direction is remarkably consistent: recognition memory commonly improves by d ≈ 0.5–1.5, with Shepard (1967) reporting approximately d ≈ 1.5, while free recall improves by roughly 1.5–2× (d ≈ 0.5–1.0) in Paivio & Csapo (1973), associative recognition produces moderate effects around d ≈ 0.3–0.7 in Hockley (2008), and classroom multimedia learning delivers smaller but reliable gains once authentic instructional complexity moderates laboratory effects. The practical implication for mind maps, concept maps, knowledge graphs, AI-generated learning summaries, and visual learning is equally consistent: distinct visual nodes strengthen item memory, spatial organization improves conceptual understanding, and meaningful integration of text with images creates richer dual coding, semantic encoding, and knowledge transfer than text alone. Research by Kulhavy et al. (1985) shows that combining maps and text improves relational learning beyond verbal instruction, while Ally et al. (2008; 2009) demonstrates that the picture superiority effect remains robust—and often grows stronger—in older adults and even mild cognitive impairment. Like an anatomical plate that reveals muscles, nerves, and organs as one coherent system instead of disconnected labels, well-designed visual representations organize ideas into structures that support both immediate recall and durable understanding, although gains in relational memory, schema construction, and complex multimedia learning still depend on coherent design and meaningful semantic relationships rather than decorative imagery alone.
Why Do People Remember Pictures Better Than Words?
Timothy Brady, Talia Konkle, George Alvarez, and Aude Oliva, MIT researchers, reported in 2008 that observers viewed 2,500 object photographs across 5.5 hours and later discriminated studied from novel images. Recognition remained 92% for novel-category foils, 88% for same-category objects, and 87% for altered states or poses, demonstrating unusually detailed visual long-term memory. ([PubMed][1])
| Audience / Industry / Use Case | Research Finding → Your Next Rep |
|---|---|
| Visual knowledge platforms | Recognition stayed 92% when studied objects were paired with novel-category objects, showing enormous visual storage capacity; visual long-term memory can preserve distinctive object representations. Build concrete, nameable visual anchors and measure delayed recognition. ([PubMed][1]) |
| Medical-image training | Accuracy remained 88% when the distractor belonged to the same basic-level category, demonstrating discrimination beyond broad semantic familiarity. Use visually distinctive exemplars within the same diagnostic category and evaluate hit rate against closely related distractors. ([PubMed][1]) |
| Product, interface and object-recognition training | Recognition reached 87% when the same object appeared in a different state or pose, indicating that visual memory preserves object detail across transformations. Train with varied views and test exemplar discrimination to measure whether the representation generalizes beyond one presentation. ([PubMed][1]) |
Are Diagrams Better Than Photographs for Free Recall and Associative Memory?
William Hockley’s 2011 experiments at Wilfrid Laurier University compared associative recognition for concrete word pairs, line-drawing pairs, mixed picture-word pairs, and photographs. Picture pairs retained an associative-recognition advantage even after individual items were recognized, while the effect persisted for both simple drawings and detailed photographs, showing that nameable imagery can strengthen relational encoding. ([PubMed][2])
| Audience / Industry / Use Case | Research Finding → Your Next Rep |
|---|---|
| Instructional diagram designers | The picture advantage persisted after participants had already identified individual items, indicating that associative recognition adds information beyond item familiarity. Build diagrams whose visual elements encode relationships and assess intact-versus-rearranged pair discrimination. ([PubMed][2]) |
| Systems and process trainers | Mixed picture-word pairs retained an attenuated advantage, showing that pictorial and verbal codes can cooperate during associative encoding. Pair concise labels with meaningful visual relations and test whether learners reconstruct the original associations. ([PubMed][2]) |
| Technical visualization teams | Simple black-and-white drawings and detailed color photographs produced similar associative effects, indicating that photographic realism itself was not necessary. Prioritize semantic clarity, nameability and relational structure over decorative realism. ([PubMed][2]) |
Does Picture Superiority Improve Studying? Classroom Multimedia Evidence
Jeanne Amlund, Janet Gaffney, and Raymond Kulhavy reported in 1985 on two experiments with elementary readers who studied maps before hearing related prose, manipulating labels, symbols, and mimetic drawings. Mimetic maps improved recall of map-featured information for weaker readers, while map-featured information remained better recalled than nonfeatured information across reader groups. ([Sage Journals][3])
| Audience / Industry / Use Case | Research Finding → Your Next Rep |
|---|---|
| Elementary science teachers | Below-average readers recalled more map-featured text after studying mimetic drawings than after label or symbol maps, demonstrating conjoint retention through spatial and verbal codes. Pair concrete visuals with explanatory prose when the target concept has spatial structure. ([Sage Journals][3]) |
| Literacy intervention programs | Good readers recalled more map-featured and nonfeatured information than poor readers, while feature-content differences disappeared in the second experiment. Visual supports interact with learner characteristics; evaluate comprehension by reader group. ([Sage Journals][3]) |
| Educational-content designers | Map-featured information was recalled better than nonfeatured information across groups, showing that spatially represented content receives a retrieval advantage. Place instructional text directly around meaningful spatial structure and test feature-specific recall. ([Sage Journals][3]) |
What Kinds of Images Improve Memory? Concreteness, Imageability and Distinctiveness
Joan Snodgrass and Brian McCullough reported in 1986 on two categorization experiments manipulating visual similarity between picture categories. Pictures were disadvantaged when categories were visually similar, such as fruits and vegetables, while their usual advantage returned for visually dissimilar categories, showing that visual distinctiveness directly influences categorization speed. ([PubMed][4])
| Audience / Industry / Use Case | Research Finding → Your Next Rep |
|---|---|
| Icon-system designers | Picture categorization slowed for visually similar categories but retained its advantage for dissimilar categories, showing that visual distinctiveness supplies a discrimination cue. Give neighboring concepts visibly separable forms and test category-decision latency. ([PubMed][4]) |
| Medical education | The fruit-versus-vegetable manipulation demonstrated that category membership becomes harder when exemplars share visual structure. Separate visually confusable diagnostic classes through distinctive silhouettes, compositions or salient features before increasing complexity. ([PubMed][4]) |
| Information-architecture teams | In mixed lists, picture responses were slowed specifically for visually similar cross-category decisions, identifying similarity as a measurable bottleneck rather than a generic picture weakness. Run discrimination tests on neighboring icons before deploying a visual vocabulary. ([PubMed][4]) |
Recognition vs Cued Recall vs Free Recall: When Does Picture Superiority Fail?
Angela Boldini, Riccardo Russo, Sahiba Punia, and S. E. Avons at the University of Essex used speed-accuracy trade-offs in three experiments published in 2007, varying the time available to recognize visually presented word targets after picture or word study. Pictures produced the standard advantage with deadlines of at least 2,000 ms, whereas deadlines below 200 ms reversed the effect. ([PubMed][5])
| Audience / Industry / Use Case | Research Finding → Your Next Rep |
|---|---|
| Flashcard and assessment designers | The picture advantage appeared with response windows of 2,000 ms or longer, indicating that recognition can require sufficient retrieval time. Evaluate accuracy across realistic and compressed deadlines. ([PubMed][5]) |
| Emergency-procedure training | Under 200-ms response deadlines, the picture advantage reversed, consistent with fast familiarity becoming more influential than slower recollection. Separate rapid recognition drills from durable learning assessments when designing high-speed interfaces. ([PubMed][5]) |
| Cognitive-training researchers | The same stimuli changed direction as retrieval time changed, demonstrating a processing-time boundary condition. Measure accuracy as a function of deadline and distinguish retrieval-process effects from the underlying memory representation. ([PubMed][5]) |
Does Picture Superiority Work for Children, Adults, and Older Adults with Dementia?
Brandon Ally, Carl Gold, and Andrew Budson at the Bedford VA and Boston University Alzheimer’s Disease Center tested picture-versus-word recognition in Alzheimer’s disease and mild cognitive impairment in 2009. Both clinical groups retained a picture-superiority effect comparable to healthy controls, indicating that pictorial encoding can preserve a recognition advantage despite substantial episodic-memory impairment. ([PubMed][6])
| Audience / Industry / Use Case | Research Finding → Your Next Rep |
|---|---|
| Memory-clinic practitioners | Alzheimer’s disease and MCI participants showed an intact picture-superiority effect during recognition, demonstrating preserved benefit from pictorial encoding. Use familiar photographs as recognition cues and measure picture-versus-word discrimination. ([PubMed][6]) |
| Cognitive-rehabilitation programs | Clinical participants benefited from pictures similarly to healthy controls, indicating that visual encoding can remain comparatively useful under episodic-memory impairment. Pair personally meaningful images with names and evaluate recognition accuracy across repeated assessments. ([ScienceDirect][7]) |
| Aging-focused learning design | The clinical finding complements ERP research showing that older adults can display a larger picture advantage than younger adults. Preserve pictorial cues when designing memory-support interfaces and distinguish confidence from actual recognition performance. ([PubMed Central (PMC)][8]) |
How Many Images Should You Use? Visual Complexity, Clutter and Hierarchy
Vahan Yoghourdjian and colleagues tested node-link diagrams containing 25–175 nodes while participants solved shortest-path problems, recording accuracy, response time, EEG, pupil dilation and heart-rate variability. High-density graphs above 50 nodes and low-density graphs above 100 nodes produced substantial difficulty, demonstrating that visual complexity can turn a useful relational map into a cognitive bottleneck. ([PubMed][9])
| Audience / Industry / Use Case | Research Finding → Your Next Rep |
|---|---|
| Knowledge-graph designers | Participants struggled with high-density graphs above 50 nodes and low-density graphs above 100, linking visual complexity to cognitive load during topology search. Partition large graphs through aggregation or filtering before expecting relational reasoning. ([VCG][10]) |
| Data-visualization teams | Accuracy and response time deteriorated as network density and size increased, demonstrating that graph readability depends on structural complexity rather than node count alone. Evaluate shortest-path accuracy and response time across density levels. ([PubMed][9]) |
| Dashboard and systems designers | EEG and pupil measures tracked increased difficulty, while cognitive load eventually decreased as participants appeared to give up. Monitor behavioral performance alongside workload measures so visual simplicity is evaluated through successful task completion. ([VCG][10]) |
Is Visual Learning a Real Learning Style? Spatial Layout vs Pictures Rival
Fofi Constantinidou and Susan Baker at Miami University compared 26 older adults with 26 younger adults in a multitrial free-recall study using auditory, visual-object, and combined auditory-visual presentation. Visual presentation produced better learning, recall and retrieval than auditory presentation alone, while age affected overall performance without eliminating the modality effect. ([ScienceDirect][11])
| Audience / Industry / Use Case | Research Finding → Your Next Rep |
|---|---|
| Corporate learning designers | Visual object presentation improved learning and recall relative to auditory presentation alone, demonstrating a modality effect independent of individualized “visual learner” labels. Compare modalities at the group level. ([ScienceDirect][11]) |
| Older-adult education | Older adults learned fewer words overall while showing a similar rate of learning to younger adults, indicating that modality support does not eliminate age differences in baseline performance. Evaluate learning rate and delayed retrieval separately. ([ScienceDirect][11]) |
| Multimodal course platforms | Simultaneous auditory-plus-visual presentation was included alongside single modalities, allowing modality effects to be separated from learner preference. Test actual retention under multiple presentation conditions. ([PubMed][12]) |
Do Mind Maps Really Work? Organization Alone vs Pictorial Advantage
Stuart Ritchie, Sergio Della Sala, and Robert McIntosh tested mind mapping and retrieval practice in two studies of 8–12-year-old children learning novel geographical facts. Retrieval practice improved delayed recall after four days and again after one and five weeks, whereas mind mapping produced no consistent additional benefit, separating organization from the stronger retrieval-practice effect. ([PLOS][13])
| Audience / Industry / Use Case | Research Finding → Your Next Rep |
|---|---|
| Primary-school geography teachers | Retrieval practice increased recall of novel geographical facts after four days, demonstrating that active retrieval produced durable memory gains. Use map construction as an organizational scaffold while evaluating learning through delayed fact retrieval. ([PLOS][13]) |
| Educational mind-map software | Across the two studies, mind mapping produced no consistent independent effect, showing that visual organization should not automatically be interpreted as improved retention. Compare map-supported study against retrieval practice. ([PubMed Central (PMC)][14]) |
| Knowledge-management platforms | The crossed design separated mind mapping from retrieval practice, revealing that visually organizing information and successfully retrieving it are different mechanisms. Measure both structural understanding and delayed recall when evaluating a knowledge map. ([PLOS][13]) |
Do Decorative Images Improve Learning? Attention, Salience and Eye-Tracking Truth
Shannon Harp and Amy Maslich examined the effect of seductive details during recorded lectures in 2005, comparing lectures containing interesting but tangential material with versions containing the core lesson alone. Students exposed to seductive details recalled fewer main points and generated fewer acceptable problem-solving solutions, extending the decorative-detail boundary from reading into lecture learning. ([Sage Journals][15])
| Audience / Industry / Use Case | Research Finding → Your Next Rep |
|---|---|
| Corporate training teams | Recorded lectures containing seductive details produced fewer recalled main points, showing that attention-grabbing material can compete with instructional content. Use decorative imagery only when it carries the lesson’s semantic load and assess main-point recall. ([Sage Journals][15]) |
| Medical presentation designers | The lecture manipulation produced fewer acceptable problem-solving solutions as well as poorer recall, linking extraneous visual interest to transfer performance. Evaluate scenario-based application alongside recall when pruning presentation imagery. |
| Educational-video producers | The effect appeared in lecture delivery, demonstrating that decorative material can impair learning beyond static text. Audit each image for instructional relevance and compare transfer performance against a content-focused version. ([Sage Journals][15]) |
Dual Coding vs Multimedia Learning vs Cognitive Load: What's the Difference?
Raymond Kulhavy, John Lee, and Larry Caterino reported in 1985 on two experiments testing conjoint retention with fifth-grade students learning maps and related discourse. Learners who encoded verbal descriptions alongside spatial maps recalled more map information, while later discourse recall depended on remembering the associated geographic features, demonstrating coordinated verbal-spatial retrieval. ([ScienceDirect][16])
| Audience / Industry / Use Case | Research Finding → Your Next Rep |
|---|---|
| Geography educators | Narrative writers remembered significantly more of a reference map than geographic-description writers in Experiment 1, demonstrating that verbal elaboration can strengthen spatial retrieval through conjoint retention. Pair relational prose with a stable spatial representation. ([ScienceDirect][16]) |
| History and process-learning platforms | In Experiment 2, learners who viewed the original map recalled more discourse events, with event recall depending on associated geographic features. Preserve image-label and spatial relationships when converting prose into visual summaries. ([ScienceDirect][16]) |
| Multimedia assessment designers | Whether learners wrote or drew their rendition, viewing the original map produced stronger discourse recall, indicating that retrieval cues depend on preserved spatial structure. Test original-versus-reorganized visual cues when measuring conjoint retention. ([ScienceDirect][16]) |
How Does the Brain Remember Pictures? Ventral Stream, Hippocampus and LTP
Brandon Ally and Andrew Budson used high-density event-related potentials in a 2007 recognition study to compare picture and word processing at study and test. Pictures enhanced a parietal retrieval component associated with recollection, while words enhanced an early frontal component associated with familiarity, providing neural evidence that the picture advantage involves differential recognition processes. ([PubMed][17])
| Audience / Industry / Use Case | Research Finding → Your Next Rep |
|---|---|
| Neuropsychology researchers | Picture presentation enhanced a parietally based ERP component during retrieval, while word presentation enhanced an early frontal component. The pattern links picture superiority to recollection-related processing. ([PubMed][17]) |
| Recognition-memory assessment | The study systematically varied picture and word modality at both study and test, revealing modality-dependent neural signatures. Separate encoding and retrieval modality when designing experiments intended to distinguish recollection from familiarity. ([ScienceDirect][18]) |
| Cognitive-neuroscience education | Familiarity was enhanced when words were studied, while pictures enhanced the neural correlate associated with recollection. Use Remember/Know or process-sensitive recognition measures. ([PubMed][17]) |
Does Picture Superiority Work for Language Learning and Vocabulary?
Shana Carpenter and Kellie Olson at Iowa State University tested Swahili vocabulary learning across four experiments comparing pictures with English translations. Pictures initially produced no reliable learning advantage and increased judgments of learning, yet retrieval practice or explicit warnings about overconfidence eliminated that bias and revealed better vocabulary learning from pictures. ([PubMed][19])
| Audience / Industry / Use Case | Research Finding → Your Next Rep |
|---|---|
| Foreign-language instructors | Across Experiments 1–3, Swahili words paired with pictures were not initially learned better than words paired with English translations, demonstrating that picture superiority can be masked by metacognitive error. Pair visual vocabulary with retrieval tests. ([PubMed][19]) |
| Language-learning apps | Participants judged picture-paired vocabulary easier to process despite weaker initial learning, exposing an overconfidence illusion. Measure delayed recall when evaluating image-based flashcards. ([PubMed][19]) |
| Vocabulary curriculum designers | Retrieval practice eliminated the overconfidence bias and allowed pictures to produce better learning than translations, linking visual encoding to metacognitive calibration. Require active word retrieval before revealing the image or translation. ([PubMed][19]) |
Does AI-Generated Imagery Improve Learning? Multimodal AI and Knowledge Graphs
Cunling Bian and colleagues reported a 2025 randomized study of 78 fifth-grade students receiving either conventional visual-art instruction or instruction incorporating Stable Diffusion-generated images. The AI-image group showed significantly higher classroom engagement and self-efficacy, no significant cognitive-load increase, and stronger evaluated artwork across several dimensions, providing early evidence for structured AI imagery in visual education. ([Nature][20])
| Audience / Industry / Use Case | Research Finding → Your Next Rep |
|---|---|
| K–12 visual-art programs | Among 78 fifth graders, the AI-image treatment increased classroom engagement relative to conventional instruction, demonstrating that generative visuals can alter participation without increasing measured cognitive load. Evaluate engagement alongside learning outcomes. ([Nature][20]) |
| AI-assisted curriculum teams | The treatment group reported stronger self-efficacy while cognitive load showed no significant difference, indicating that AI-generated imagery can increase perceived capability without automatically increasing workload. Validate both learner confidence and objective performance. ([Nature][20]) |
| Educational-content production | Expert evaluations of student artwork covered technical skill, thematic adherence, composition, creativity, effort and improvement, providing a multidimensional outcome framework. Evaluate AI-supported visual instruction through domain-specific artifacts. ([Nature][20]) |
Testing Effect vs Spacing Effect vs Picture Superiority: Which Wins for Retention?
Douglas Hintzman and Miriam Rogers studied spacing in picture memory in three experiments using vacation slides, manipulating repetition frequency and spacing intervals. Spacing affected frequency judgments similarly to verbal materials, filled and unfilled intervals produced comparable spacing patterns, and the results provided no evidence that overt rehearsal explained the picture-memory spacing effect. ([PubMed][21])
| Audience / Industry / Use Case | Research Finding → Your Next Rep |
|---|---|
| Spaced-repetition platforms | Repeated vacation slides produced a spacing effect resembling verbal-material findings, demonstrating that spacing applies to complex visual stimuli. Schedule image reviews across separated sessions. ([PubMed][21]) |
| Visual flashcard systems | Filled and unfilled spacing intervals produced comparable effects, indicating that spacing duration itself mattered more than a simple rehearsal account. Optimize review intervals while measuring delayed recognition or recall. ([PubMed][21]) |
| Visual learning researchers | No evidence showed that pictures were overtly rehearsed, weakening rehearsal as a complete explanation for spacing. Combine spacing with retrieval measures so repeated visual exposure is distinguished from active retrieval practice. ([PubMed][21]) |
When Does Picture Superiority Fail? Abstract, Ambiguous and Emotional Images
Andreas Bayer and colleagues examined emotional words, phrases, pictograms and photographs with controlled arousal and visual complexity in an fMRI study. Emotional pictures produced no general processing superiority over words once stimulus complexity was controlled, while modality differences remained concentrated in perceptual brain regions, demonstrating that apparent emotional-picture advantages can depend on perceptual features. ([PubMed Central (PMC)][22])
| Audience / Industry / Use Case | Research Finding → Your Next Rep |
|---|---|
| Clinical-image designers | After controlling emotional arousal, pictorial stimuli showed no general emotional-processing superiority over words, indicating that emotional intensity alone cannot guarantee a memory advantage. Validate image complexity and semantic clarity independently from arousal. ([PubMed][23]) |
| Safety and emergency training | Pictograms, photographs, phrases and words differed partly through perceptual complexity, showing that visually rich stimuli can introduce modality-specific processing demands. Test whether the visual form itself supports the intended decision before increasing realism. ([PubMed Central (PMC)][22]) |
| Cross-cultural visual communication | The study controlled stimulus arousal while varying visual form, demonstrating that perceptual properties can influence apparent picture effects. Use culturally interpretable, semantically stable imagery and test recognition or comprehension across intended audiences. ([PubMed][23]) |
Picture Superiority in the Wild: Designing Visual Knowledge That Sticks
A Renaissance anatomist rarely relied on text alone when teaching the human body. Detailed anatomical plates transformed muscles, bones, nerves, and organs into visual landmarks that apprentices could recognize long before they could recite every Latin term. The illustration became a memory scaffold, while labels supplied the language that completed understanding. The picture superiority effect, explained by Dual Coding Theory and supported by decades of cognitive psychology, follows the same principle. Pictures, mind maps, concept maps, knowledge graphs, instructional diagrams, and AI-generated visual summaries consistently outperform text alone because they combine visual memory, semantic encoding, and verbal encoding into richer retrieval pathways. For instructional design, educational technology, AI learning tools, knowledge management, corporate learning, and multimedia learning, the highest-quality learning resources deliberately maximize visual distinctiveness, spatial organization, semantic relationships, dual coding, and conceptual understanding while eliminating decorative elements that increase extraneous cognitive load without improving knowledge retention.
How to Assess Prior Knowledge Before Teaching? Visual Prior-Knowledge Profiles
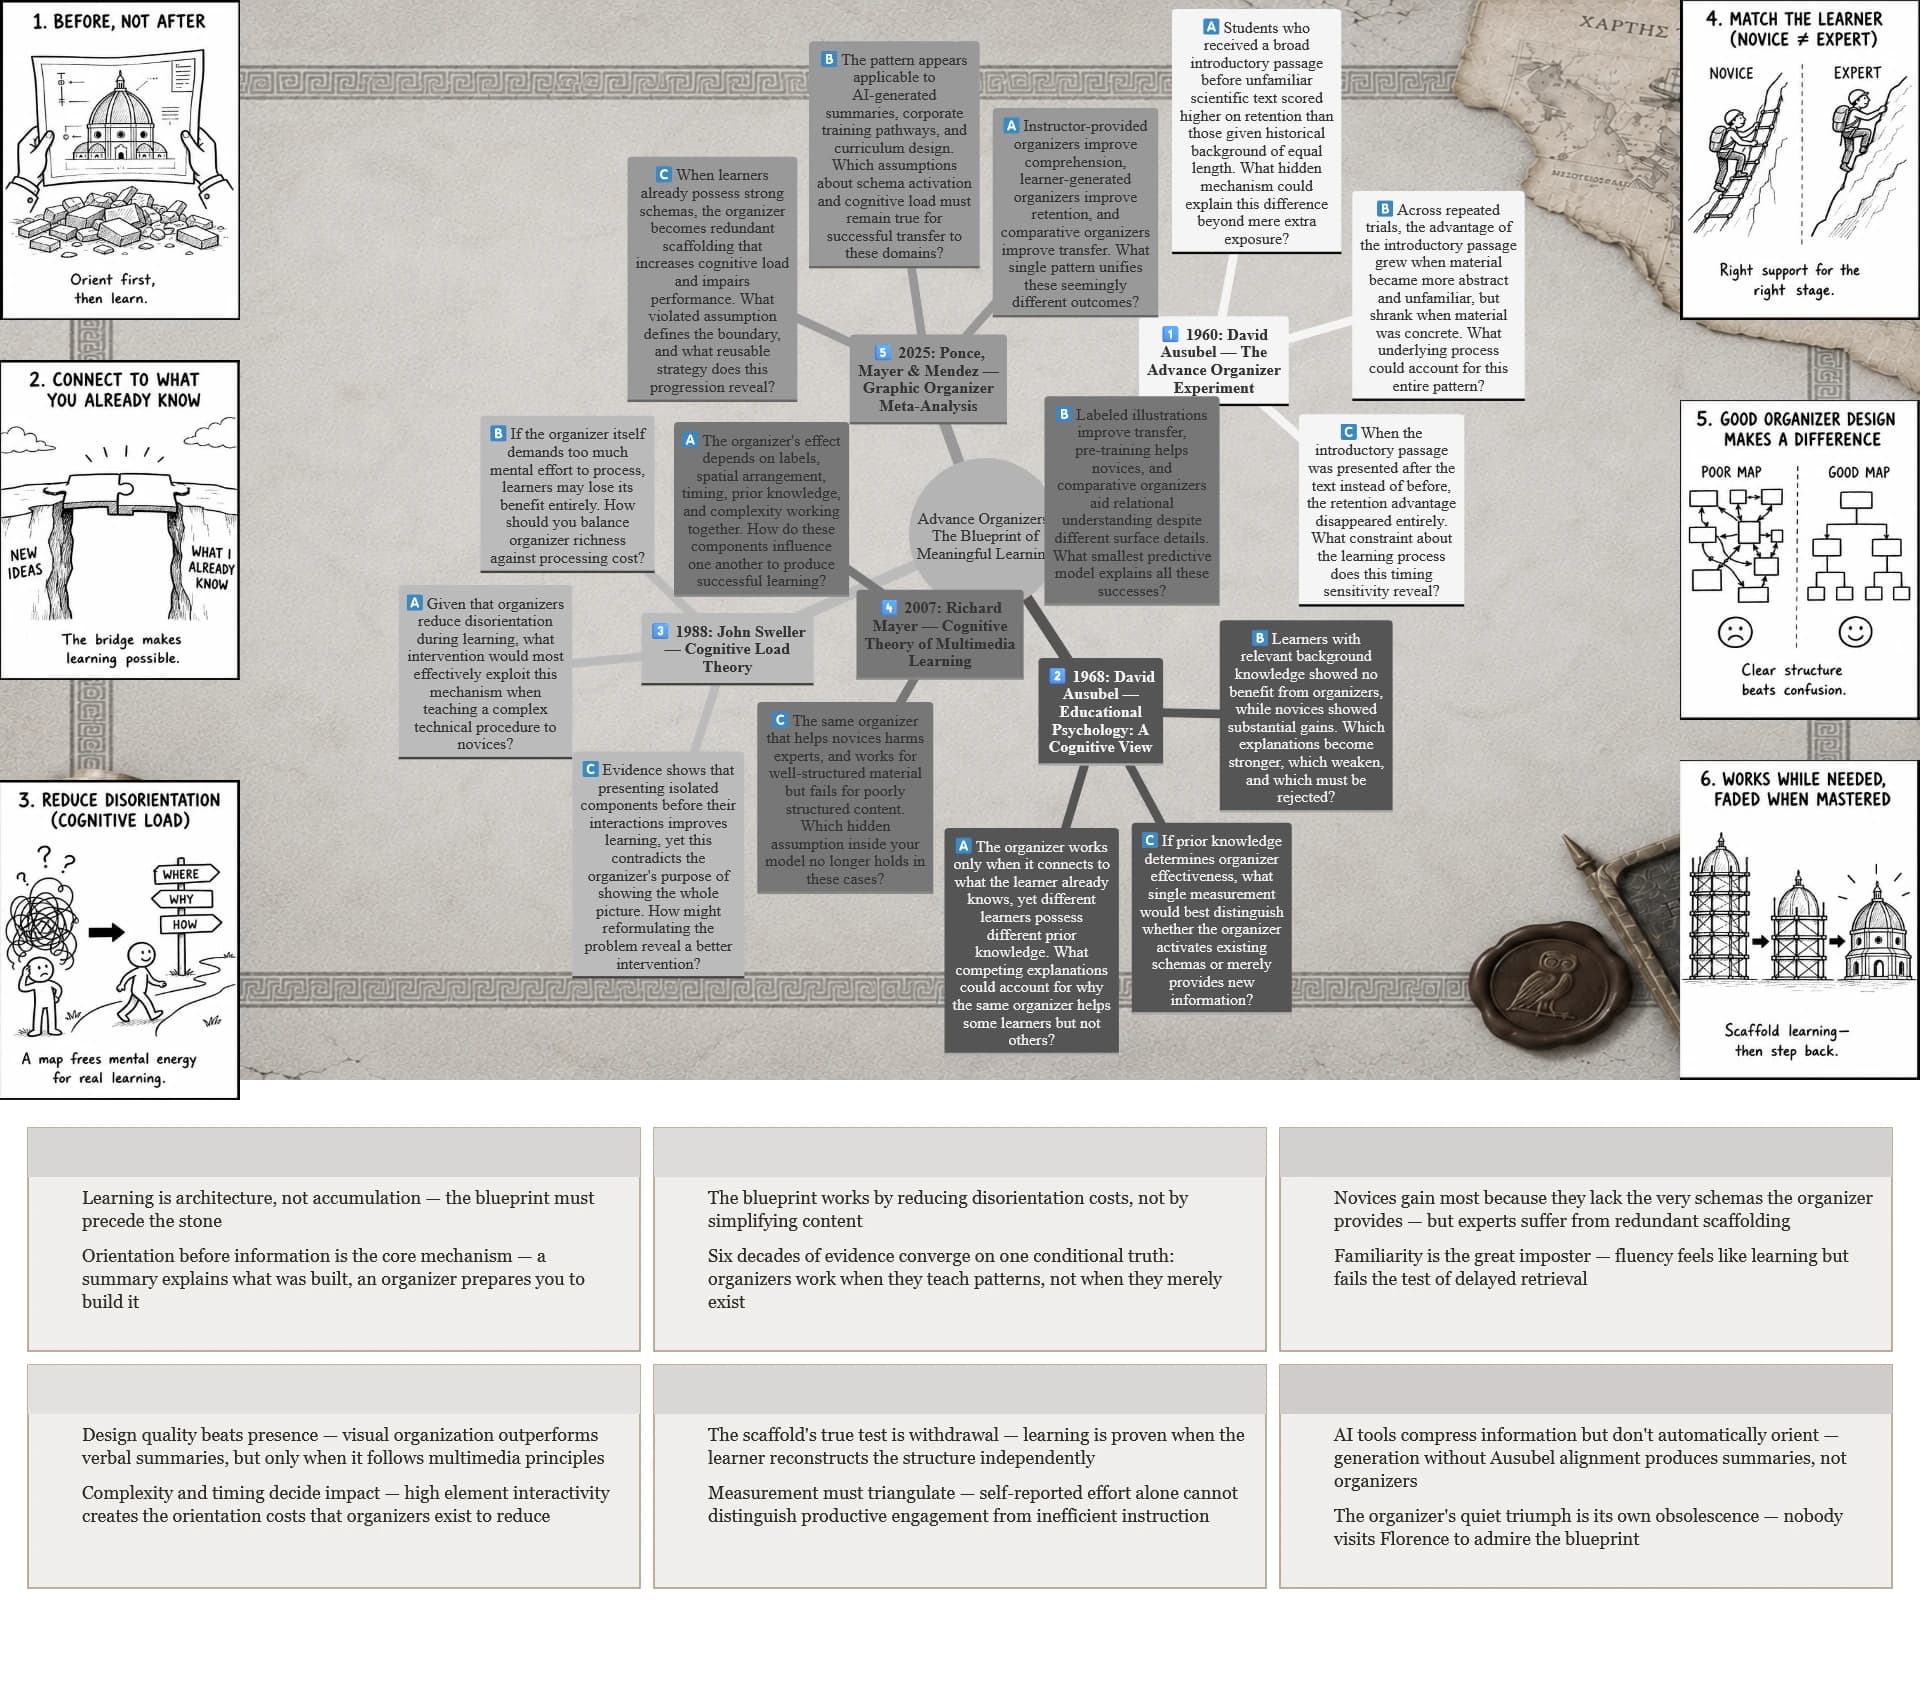
In 1972, John D. Bransford and Marcia K. Johnson of the State University of New York at Stony Brook tested how contextual information affected comprehension and recall of a difficult prose passage across five conditions. A 30-second visual context presented before the passage raised recall to 8.0 of 14 idea units versus 3.7 without context, while repetition or context supplied afterward produced little improvement, showing that prior knowledge must be activated before instruction.
| Audience / Industry / Use Case | Research Finding → Your Next Rep |
|---|---|
| Secondary-school science teachers | Bransford and Johnson's participants recalled about 8.0/14 idea units when the relevant picture preceded the passage, versus 3.7/14 without context. The result directly supports schema activation, prior knowledge, visual cues, and meaningful learning: make prerequisite concepts recognizable before presenting new explanatory material, then measure recall against the no-context baseline. |
| Corporate onboarding and LMS design | Hearing the same passage twice produced only 3.8 recalled idea units, essentially unchanged from the 3.7 no-context condition. Thus episodic memory, semantic memory, instructional scaffolding, and metacognition cannot be treated as simple exposure: orientation should establish a usable schema before the main lesson. |
| University prerequisite assessment | Context supplied after the passage produced roughly 3.6 recalled units, while partial context produced about 4.0, far below the full pre-context condition. This separates concept acquisition, schema-tagging, transfer of learning, and diagnostic assessment: measure whether learners can recognize the prerequisite structure before teaching, not merely whether they can recognize it afterward. |
How to Activate Schemas Fast? Advance Organizers That Trigger Dual Coding
John W. Luiten, Wilbur S. Ames, and Gary E. Ackerson of the University of Arizona published a 1980 meta-analysis covering 135 studies of advance organizers across grade levels, subjects, presentation modes, and ability levels. The pooled evidence found a small facilitative effect on learning and retention, with reported average effects around d = 0.21, supporting advance organizers as a modest bridge into new material rather than a universal treatment.
| Audience / Industry / Use Case | Research Finding → Your Next Rep |
|---|---|
| K–12 curriculum designers | Across 135 studies, advance organizers produced a small positive effect on learning rather than a large transformation. The finding connects advance organizers, schema activation, meaningful learning, and pre-training: place a concise conceptual frame before the lesson, then compare post-learning performance with instruction lacking the organizer. |
| University course designers | The meta-analysis examined effects across different grade levels and subject areas. That breadth supports treating prediction, semantic activation, spatial hierarchy, and concept maps as transferable design elements, while evaluating their effect within the specific course rather than assuming the same magnitude everywhere. |
| Corporate training platforms | Luiten, Ames, and Ackerson also examined organizer presentation mode and learner ability, finding an overall facilitative effect but not evidence that organizers eliminate differences between learner populations. This supports dual coding, referential connections, cognitive load, and scaffolding as design considerations that still require learner-specific evaluation. |
Best Way to Turn Notes into Mind Maps That Stick? Distinctive Branch Design
Jean-François Delvenne of the University of Leeds and Kevin Dent of the University of Essex reported four experiments in 2008 testing whether distinctive shapes improved memory for color–shape associations. Distinctive shapes did not improve memory for colors alone, but they did improve memory for specific color–shape pairings, with later experiments indicating that the advantage arose during memory rather than simply at encoding or retrieval.
| Audience / Industry / Use Case | Research Finding → Your Next Rep |
|---|---|
| Instructional designers | Experiment 1 found no advantage when participants remembered colors alone, but Experiment 2 found better memory when they had to remember color–shape pairings. This demonstrates why visual distinctiveness, color coding, icon consistency, and visual chunking should serve an association rather than decorate a node. |
| Mind-map and knowledge-management software | The heterogeneous-shape advantage appeared when the task required remembering the binding between features, not the individual colors. That supports figure-ground separation, spatial hierarchy, semantic links, and distinctive branch identity when the retrieval target is a relationship rather than an isolated fact. |
| Professional training materials | Experiments 3 and 4 indicated that the distinctive-shape benefit was memorial, rather than attributable simply to encoding or retrieval-stage differences. The practical implication for progressive disclosure, white space, responsive graphics, and long-term retention is to preserve distinctive visual identities across later encounters so the association remains discriminable. |
Concept Maps vs Mind Maps: Which Builds Transferable Knowledge?
In 1997, Maria Araceli Ruiz-Primo, Richard J. Shavelson, and Susan Elise Schultz at Stanford/CRESST experimentally examined whether hierarchical concept maps validly represented students' science knowledge. High-school chemistry classes worked with different mapping structures; raters achieved agreement above .90, while concept-map and multiple-choice scores correlated about r = .31, indicating overlapping but non-identical information about declarative knowledge.
| Audience / Industry / Use Case | Research Finding → Your Next Rep |
|---|---|
| University science instructors | Raters achieved agreement above .90 when scoring the concept maps, showing that a structured scoring system can make concept maps, labeled links, semantic networks, and relational memory usable as an assessment format. The practical measure is inter-rater agreement, not simply whether a map looks visually sophisticated. |
| Research institutes and curriculum developers | Concept-map scores correlated with multiple-choice scores at about r = .31, showing substantial overlap but also distinct information. This supports knowledge graphs, hierarchy, causality, and semantic networks as complementary representations. |
| Cross-disciplinary knowledge-management systems | The study found the evidence inconclusive on whether different mapping techniques produce identical information about knowledge. That boundary condition matters for graph visualization, ontology visualization, proximity, and hierarchy: preserve the task and scoring method when comparing maps because changing representation can change what the assessment measures. |
How to Summarize 50-Page PDFs So Teams Actually Remember Them?
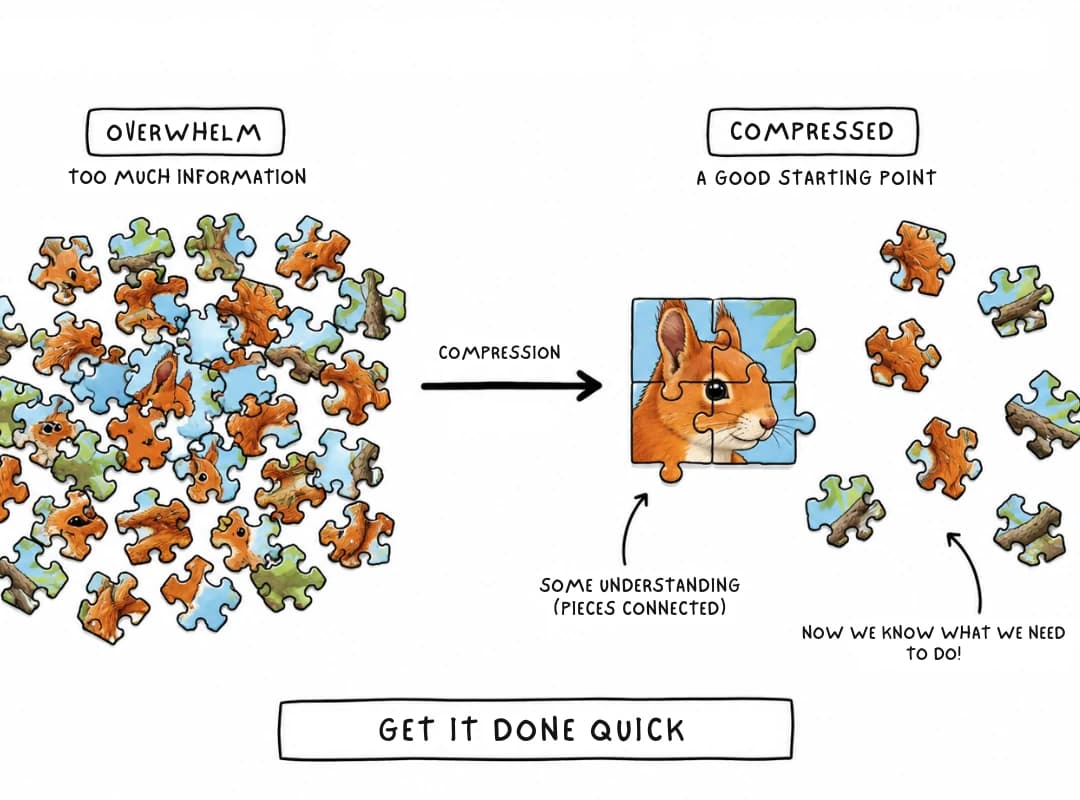
Katrien De Westelinck, Martin Valcke, Brigitte De Craene, and Paul Kirschner published a 2005 series of six experimental studies at Ghent University and the Open University of the Netherlands examining external graphical representations in educational-science materials. Across the experiments, graphics did not consistently improve retention or transfer; in one sub-study, text without graphics produced significantly higher performance, while spatially integrated graphics produced lower transfer than non-integrated versions.
| Audience / Industry / Use Case | Research Finding → Your Next Rep |
|---|---|
| Corporate knowledge-management teams | In the multimedia-principle comparisons, materials without external graphics generally produced higher mean post-test scores, with one significant comparison reaching d = 1.12 for transfer and d = 0.95 for total post-test performance. This qualifies visual encoding, dual coding, semantic organization, and cognitive load: compressing a long document into a diagram only helps when the representation is interpretable. |
| University instructional designers | Spatially integrated representations did not outperform non-integrated ones; in one sub-study, the non-integrated condition had higher transfer and total-test scores, both at approximately d = .72. Thus image-label proximity, spatial hierarchy, contiguity, and working-memory load cannot be treated as unconditional rules when learners lack the representational conventions needed to interpret the diagram. |
| AI document-summarization platforms | Summaries containing external graphical representations showed higher descriptive post-test scores in the coherence comparison, although the differences were not statistically significant. This supports AI-generated summaries, diagrams, visual organization, and knowledge retention only when the visual actually represents the relevant structure; decorative compression should not be counted as demonstrated learning. |
How to Teach Vocabulary 2x Faster? Visual Glossaries for Healthcare, Engineering, ESL
In 2008, In-Ok Kim of Chuncheon National University of Education and Seung Yeon Han of Soyang Elementary School compared explicit English vocabulary teaching through student-made picture dictionaries with implicit oral instruction among third-grade learners. The explicit picture-dictionary group improved vocabulary skills more, showed no significant difference in interest, and recalled learned vocabulary more evenly through words and pictures, whereas the comparison group recalled more through words.
| Audience / Industry / Use Case | Research Finding → Your Next Rep |
|---|---|
| Elementary ESL programs | Explicit vocabulary instruction through picture-dictionary construction produced greater vocabulary improvement than implicit oral instruction. The combination of visual glossaries, picture dictionaries, vocabulary acquisition, and lexical access gives a concrete model: pair the unfamiliar word with a learner-generated visual representation and assess vocabulary performance against conventional instruction. |
| Healthcare and engineering training | The picture-dictionary group did not show a significant advantage in interest, despite its vocabulary advantage. This separates visual literacy, meaningful imagery, dual coding, and motivation: improved lexical performance should be measured directly. |
| Technical terminology and second-language platforms | The control group remembered vocabulary more through words, whereas the picture-dictionary group remembered words and pictures more evenly. The result connects bilingual memory, picture naming, image-label proximity, and semantic encoding to the form of the resulting memory trace. |
How to Design Learning Modules, Dashboards and UI That People Remember?
Siné J. P. McDougall, Martin B. Curry, and Oscar de Bruijn studied icon design and human–computer interaction in 1991 by manipulating the relationship between an icon's visual form and its meaning during menu-selection tasks. Articulatory distance affected reaction time when icon positions were randomized, but not when positions were fixed; after practice, participants could recode icon meanings to screen positions, reducing the importance of icon design for experienced users.
| Audience / Industry / Use Case | Research Finding → Your Next Rep |
|---|---|
| UX and dashboard designers | When icon positions were randomized, articulatory distance affected menu-selection reaction time. This links icon usability, interface cognition, semantic distance, and recognition directly to interaction speed: visual symbols must communicate their intended meaning rather than depend entirely on positional memory. |
| Enterprise software designers | When icons appeared in fixed positions, articulatory distance no longer affected selection performance. This shows that spatial consistency, visual hierarchy, icon redundancy, and recognition can interact: stable placement can compensate for weaker semantic correspondence, although that benefit depends on users learning the interface. |
| Consumer and mobile-interface teams | After training, users were able to recode icon meanings to screen positions, showing why advanced users can operate interfaces differently from novices. For accessibility, responsive graphics, visual literacy, and usability testing, test both novice recognition and trained performance. |
How to Organize Knowledge into Frameworks Without Overload?
George Mandler's 1972 experiments examined how categorization affected free recall of word lists, manipulating the number and organization of categories rather than changing the words themselves. When participants were free to organize words, the number of categories became significantly related to recall; in a third experiment spanning 2–19 categories, recall remained positively associated with the number of categories rather than showing the assumed sharp retrieval limit.
| Audience / Industry / Use Case | Research Finding → Your Next Rep |
|---|---|
| University study-skills programs | In Experiment I, recall occurred before sorting and the category-number/recall relationship was not significant; when organization was introduced before recall, the relationship became significant. This connects concept grouping, hierarchy, spatial organization, and semantic memory to the sequence in which knowledge is organized and retrieved. |
| Enterprise knowledge-base designers | Experiment II removed fixed category limits and sorting criteria, after which the number of categories correlated significantly with recall. The result supports knowledge frameworks, proximity, visual hierarchy, and retrieval cues: a framework can create retrieval structure even when the underlying items remain unchanged. |
| Information-architecture teams | Experiment III found a significant relationship across 2–19 categories, challenging the assumption that more categories automatically exceed a fixed retrieval capacity. This qualifies visual hierarchy, white space, concept grouping, and cognitive load: organization should be evaluated through retrieval performance. |
Flashcards vs Visual Quizzes: Best Retrieval Practice for Long-Term Recall?
Xiaofeng Ma and colleagues at Northwest Normal University and the University of York studied retrieval practice in 104 first-grade students who learned the contents of 15 pictures under feedback, elaboration, retrieval-without-feedback, and repetitive-learning conditions. Recognition was tested after 5 minutes, one week, and one month; retrieval with feedback outperformed elaboration at all three delays, while retrieval without feedback exceeded repetitive learning only at the one-month delay.
| Audience / Industry / Use Case | Research Finding → Your Next Rep |
|---|---|
| Elementary-school learning platforms | Retrieval with feedback produced higher picture-recognition scores than elaboration at all three delay intervals. This directly connects retrieval-based learning, visual quizzes, feedback, and recognition: assessment should require learners to retrieve the visual information. |
| Digital flashcard systems | Retrieval without feedback did not significantly outperform repetitive learning at 5 minutes or one week, but its hit rate was higher after one month. The delayed effect connects spacing, delayed recall, visual cues, and long-term memory and shows why immediate quiz performance is insufficient as the sole evaluation metric. |
| Visual assessment in primary education | Feedback-based retrieval outperformed elaboration despite all groups learning the same picture material. The result supports combining concept maps, labeled images, application tasks, and retrieval practice, with delayed recognition providing the measurable outcome. |
How to Build One Scalable Visual Learning System? Integrated EdTech Workflow
Qian Zhang and Logan Fiorella's 2019 study assigned 134 college students to different sequences of provided and learner-generated drawings while studying a lesson on the human circulatory system, followed by recall and transfer tests. In a second experiment with 85 students, generating a drawing while receiving the provided visual as feedback required more time and cognitive load but produced significantly better comprehension than studying the provided visual alone.
| Audience / Industry / Use Case | Research Finding → Your Next Rep |
|---|---|
| EdTech product designers | In Experiment 1, the drawing conditions required significantly more time and cognitive load, yet the three learning sequences did not differ in learning outcomes. This qualifies generative learning, visual encoding, cognitive load, and multimodal learning analytics: more activity is not automatically more learning, so the product should instrument actual comprehension and transfer. |
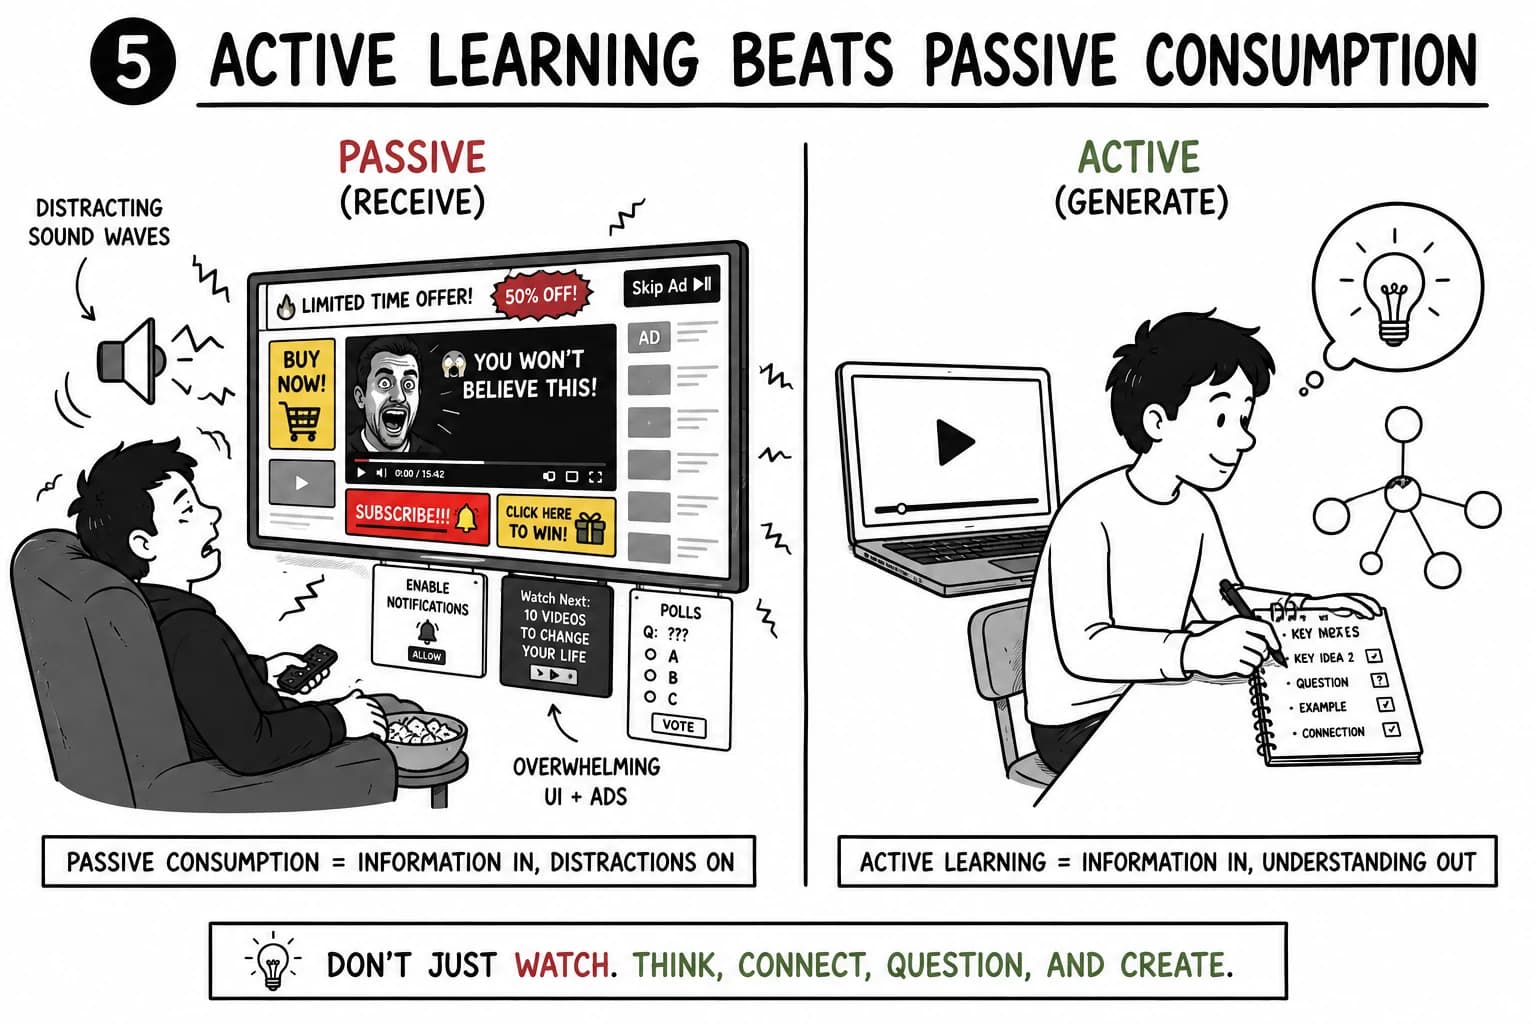
| University science platforms | In Experiment 2, generating drawings with provided visuals as feedback produced significantly better comprehension than provided visuals alone, despite higher time and cognitive load. This gives a direct advance organizer → visual generation → feedback → retrieval/transfer workflow, with comprehension providing the measurable endpoint. |
| Corporate learning systems | Spatial ability predicted learning from generated but not provided visuals, while drawing quality mediated the relationship in the reported study. The result connects personalization, embodiment, visual semantic processing, and learning analytics: generated-visual activities should be evaluated with learner differences. |
Why Are Learners Forgetting? Visual Knowledge-Gap Audit Checklist
Jia Shi, William B. Wood, Jennifer M. Martin, Nancy A. Guild, Quentin Vicens, and Jennifer K. Knight at the University of Colorado Boulder developed and validated the 24-question Introductory Molecular and Cell Biology Assessment in 2010. The instrument was built from faculty-defined learning goals, student interviews identifying misconceptions, misconception-based distractors, expert review by 25 biology experts, and pre/post administration to more than 1,300 students across three institutions.
| Audience / Industry / Use Case | Research Finding → Your Next Rep |
|---|---|
| University biology departments | The researchers first interviewed students to identify recurring misconceptions and converted those incorrect ideas into distractors rather than relying only on correct-answer rates. This operationalizes knowledge-gap audits, diagnostic assessment, metacognition, and concept acquisition by distinguishing a missing concept from a predictable misconception. |
| Curriculum and assessment teams | The initial instrument contained 43 questions across 15 learning goals, but faculty and follow-up evidence led the researchers to remove or revise goals and questions. This demonstrates content validity, schema tagging, visual knowledge gaps, and remediation: diagnostic instruments need iterative refinement around the errors learners actually exhibit. |
| LMS analytics and learning platforms | The final IMCA used 24 multiple-choice questions and was designed for pre/post administration, allowing overall gains, learning-goal-specific performance, and persistent misconceptions to be separated. That provides a concrete baseline comparison, confidence/diagnostic data, concept acquisition, and transfer workflow: flag the specific knowledge gap, reteach it, and compare the same diagnostic construct afterward. |
Lascaux endures because pigment on stone gave each aurochs its own wall, its own posture, its own placard of ochre. The filing cabinet came later, and memory never liked it as much. Hang each concept like it matters — distinct, labeled, and spaced — and learners will remember the gallery.