Get to the argument. Challenge the evidence.
AI tools for consultants usually stop at summarization. y2map goes further: it turns lengthy reports, research and client documents into standalone single-page cognitive artifacts that help consulting teams can review information, expose assumptions and develop a shared understanding of complex business problems.
The promise is simple: spend less time locating the argument in every report and more time surfacing facts, challenging the assumptions, finding patterns, exposing blindspots and expanding decision trees. Extract more value from existing research, reduce duplicated analytical effort, and turn completed engagements into reusable intellectual capital.
Taxes and Dividends
Consulting teams pay a clarity tax whenever analysts repeatedly interpret the same evidence, struggle to verify claims, discover dependencies late and inherit knowledge they must reconstruct. y2map converts this recurring cost into a clarity dividend: shared understanding established earlier, stronger analytical connections and more time for the critical thinking that produces better recommendations.
- Recover analytical time. Six advance-organizer cards establish the report’s overarching principles before detailed reading, giving analysts a shared conceptual foundation and allowing engagement time to focus on implications and decisions.
- Make every claim traceable. Evidence-backed summaries connect conclusions to source quotations and page references, turning research review into a faster, verifiable process.
- Surface connections earlier. Illustrated mindmaps make relationships between commercial, financial and operational findings visible, helping teams identify dependencies before synthesis and client presentations.
- Improve the quality of hypotheses. Socratic driving questions prompt teams to test assumptions, investigate contradictory evidence and consider alternative explanations before committing to a recommendation.
- Compound the value of completed research. Reusable cognitive artifacts preserve an engagement’s essential reasoning in a form future teams can understand, verify and extend instead of rebuilding the analytical foundation.
The gap is not extraction — general-purpose AI produces summaries easily. The gap is the progression from research compression to visual synthesis to critical inquiry, producing the shortest path to a shared surface for subsequent investigation.
Shared analytical clarity
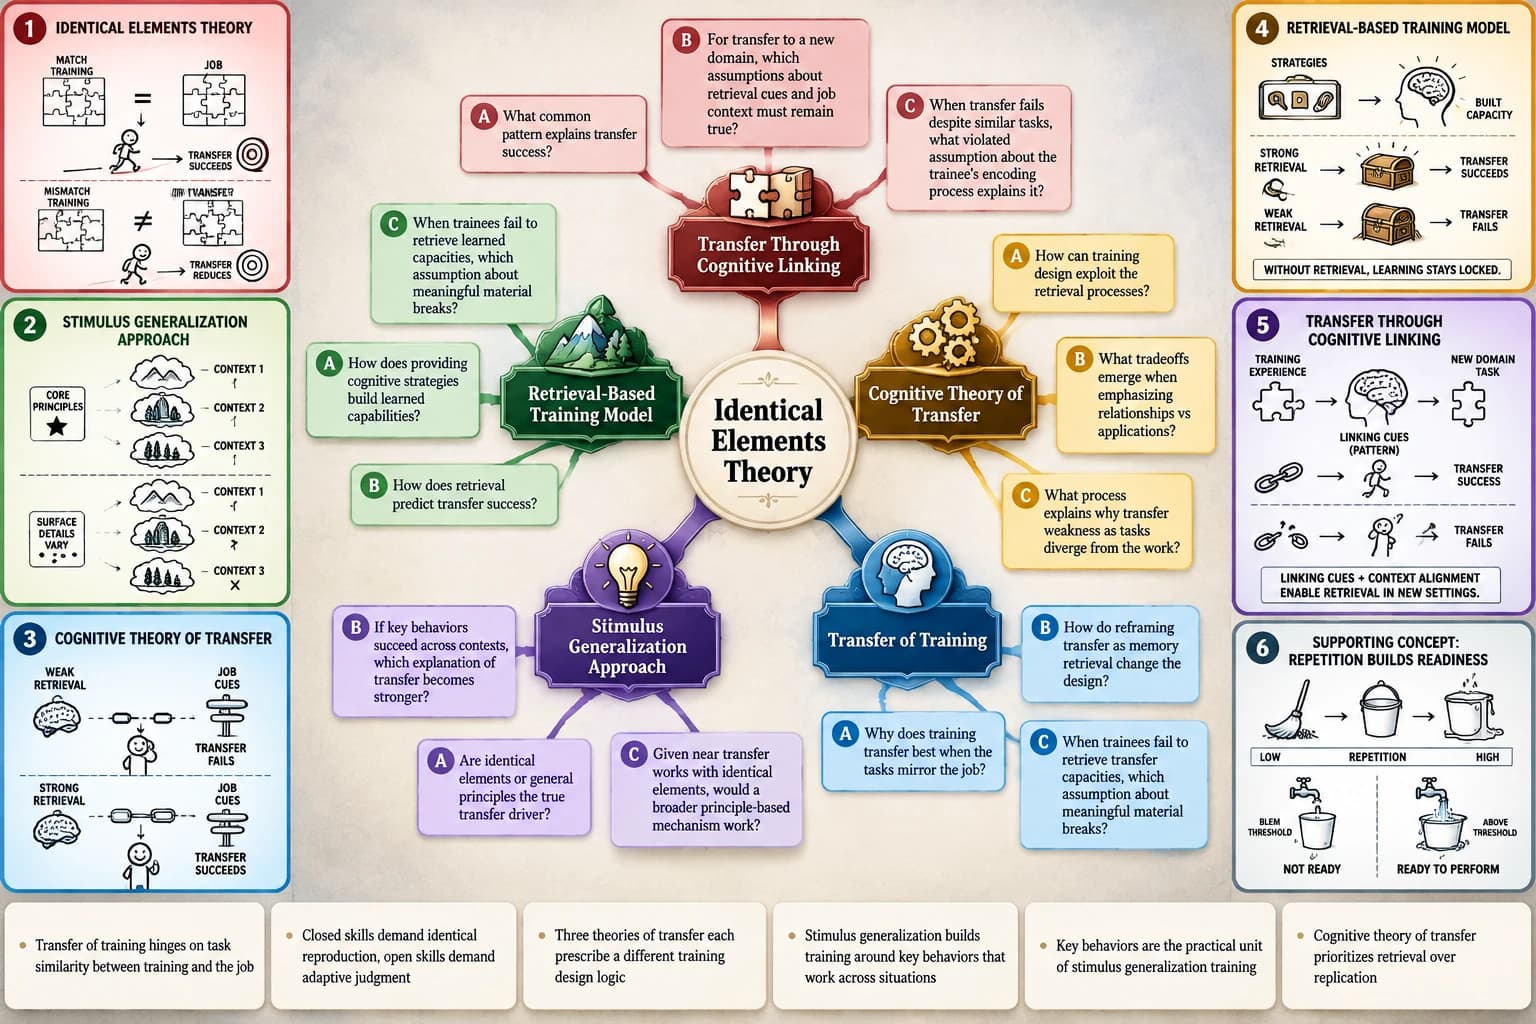
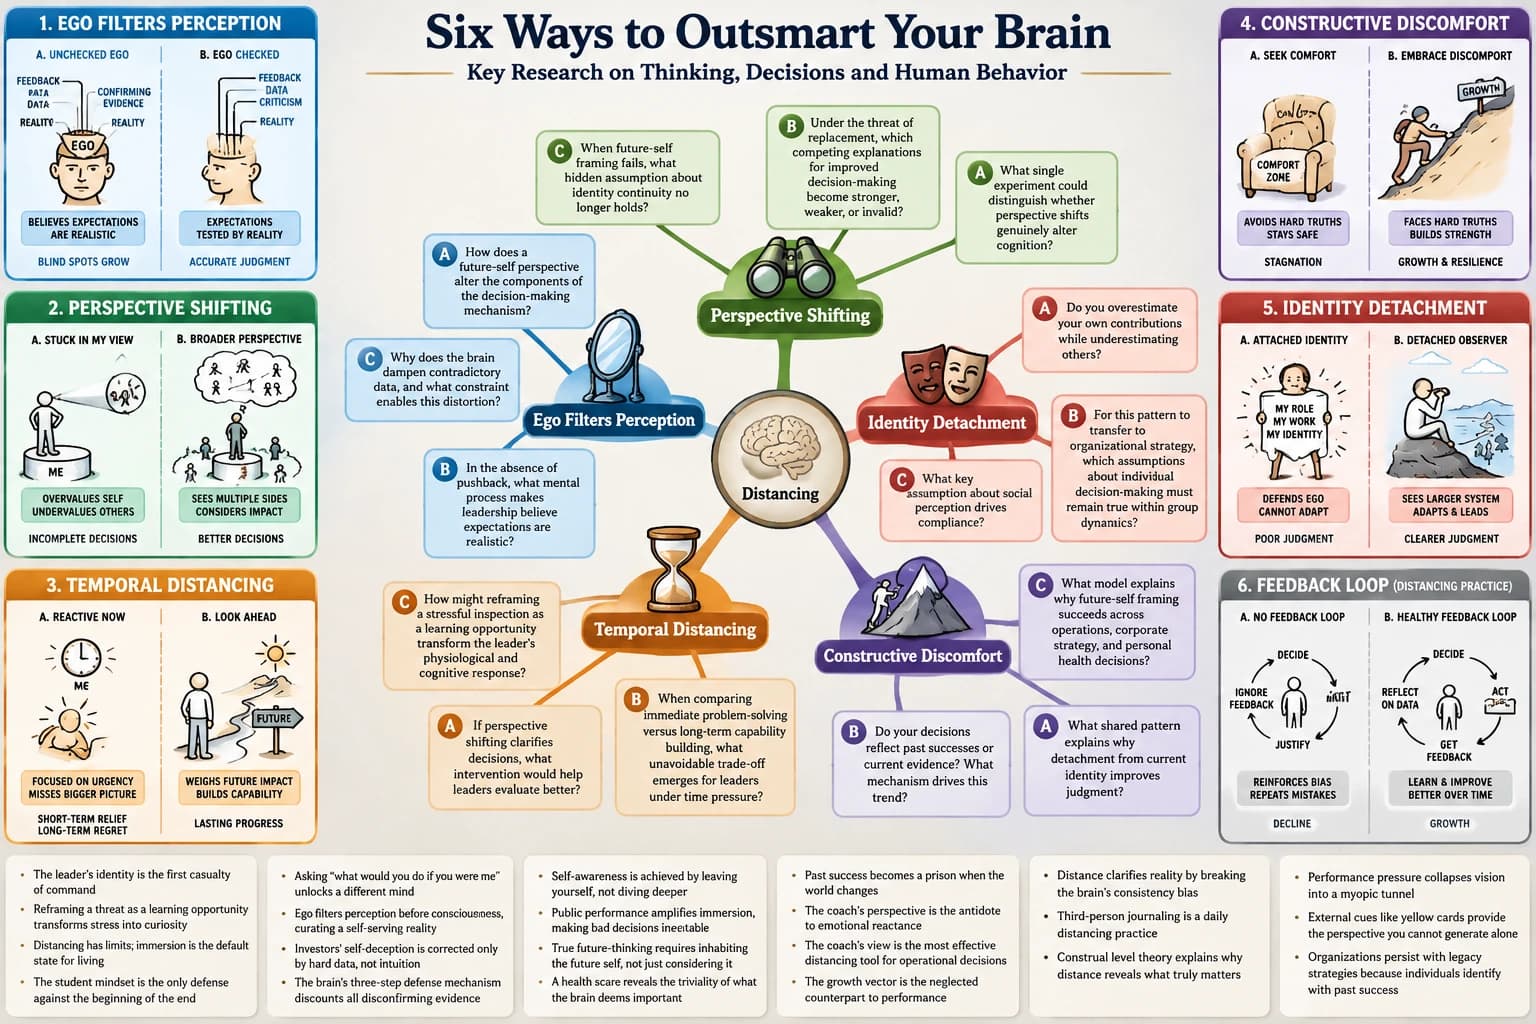
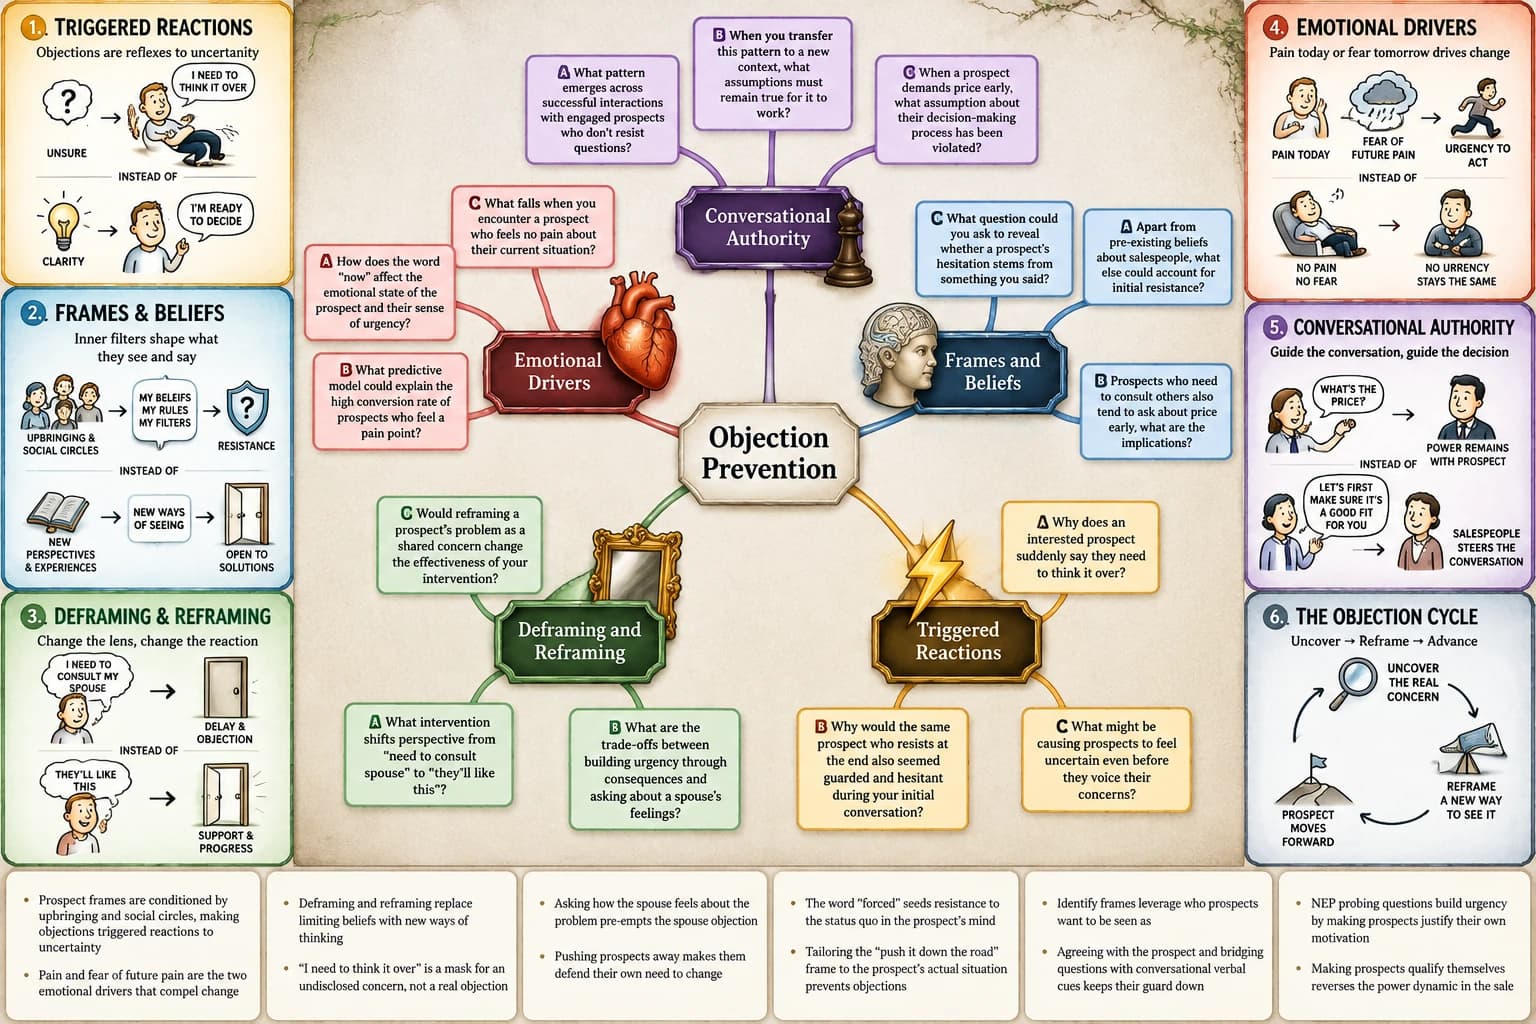
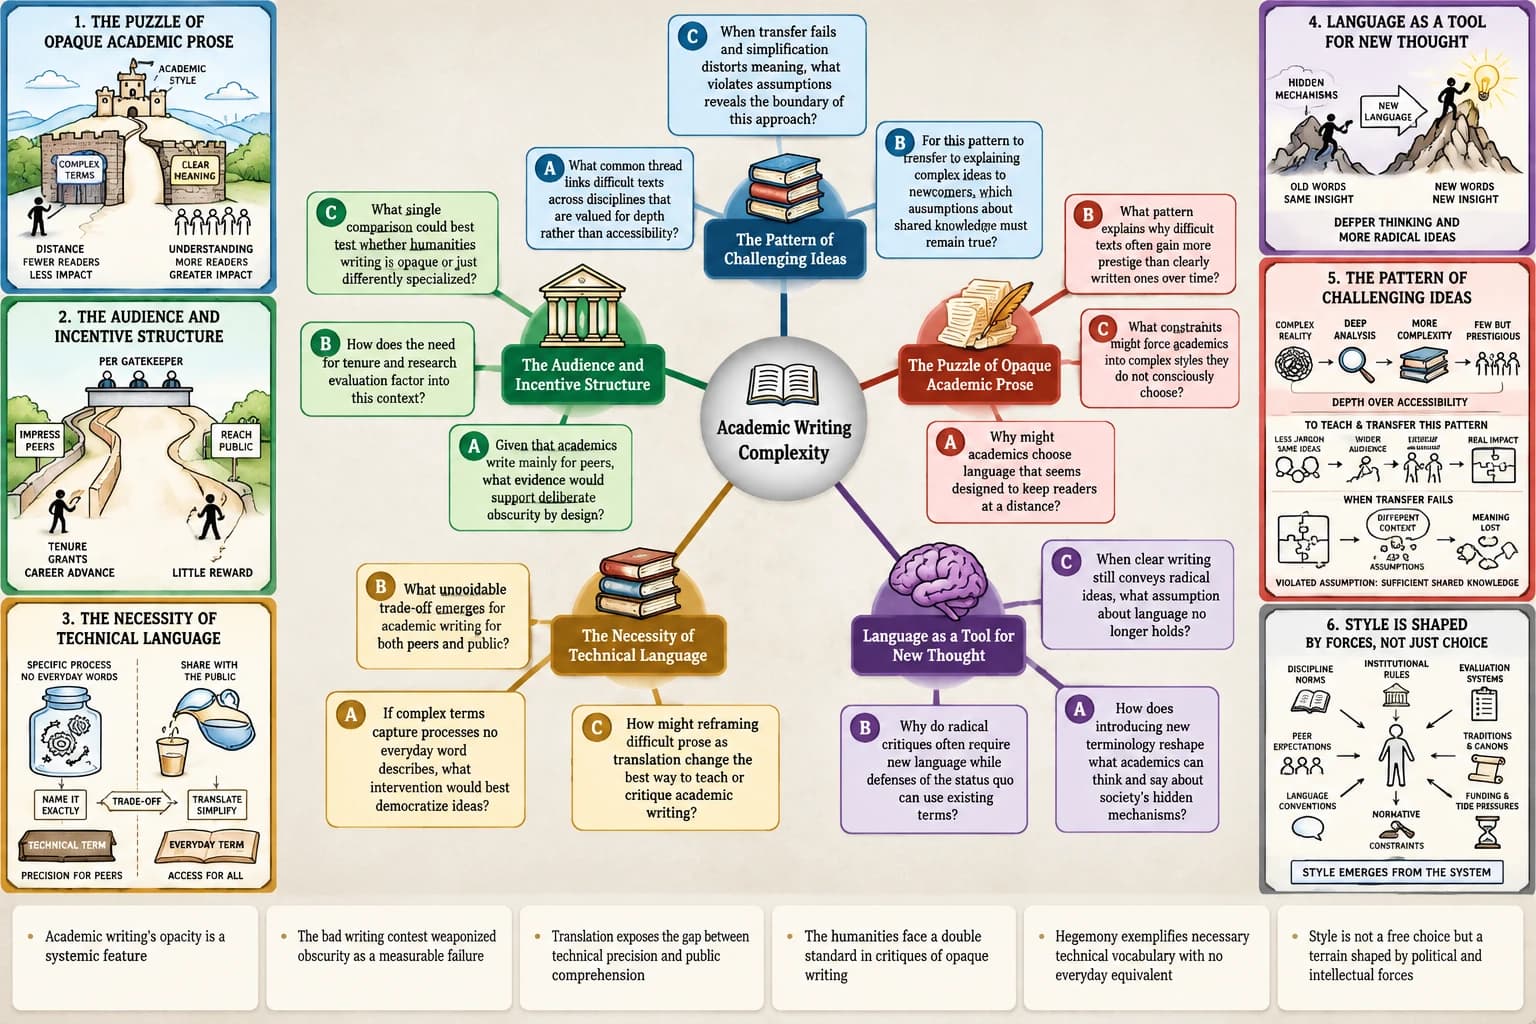
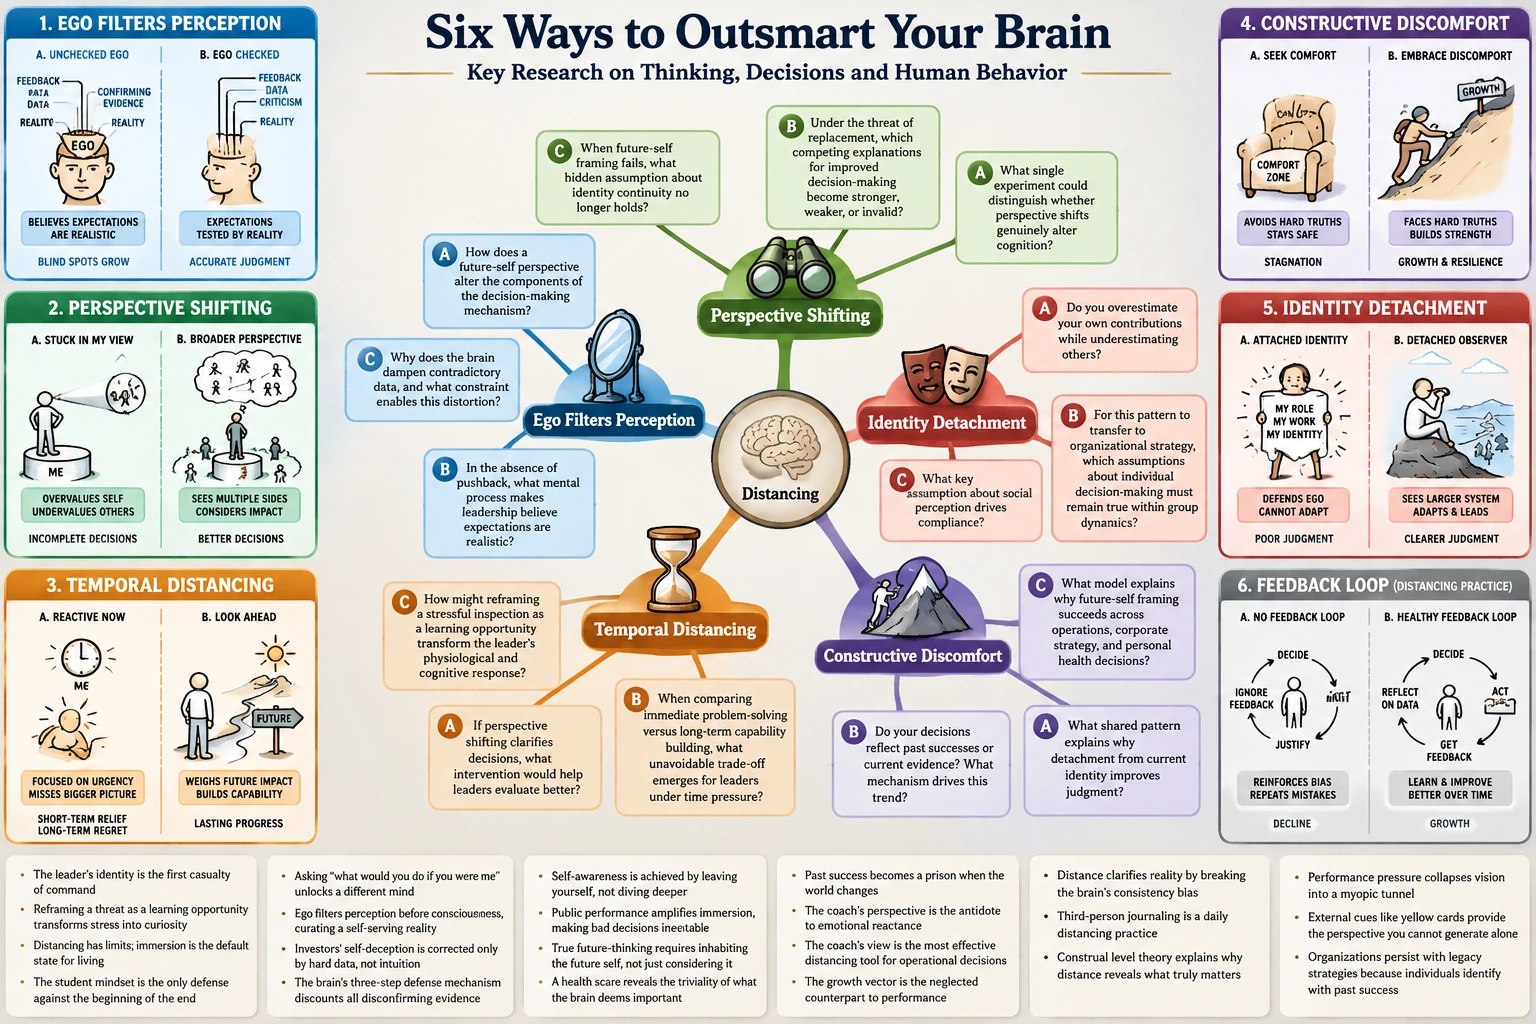
y2map converts dense research into a three-part cognitive artifact that turns individual reading into shared understanding. The Advance organizer establishes the key mental models, visual learning panels make abstract ideas intuitive, and a Socratic questioning mindmap helps engagement teams uncover hidden assumptions, connect patterns and investigate blindspots that help create a set of comprehensive recommendations that cover more of the solution space.
1. Advance organizers — grasp the essential mental models
Concise explanations distill a complex report into its overarching principles, central arguments and key relationships. An associate entering an unfamiliar industry can understand its underlying economics and competitive dynamics before investing hours in detailed market research, giving the engagement team a common analytical starting point.
2. Visual learning panels — make abstract ideas intuitive
Six illustrated panels translate difficult concepts into concrete visual mechanisms that consultants can grasp and communicate quickly. An engagement team studying an industry can visualize how market forces, operational constraints, customer behavior and financial outcomes interact, accelerating comprehension and revealing connections that are difficult to see across separate documents.
3. Socratic questioning mindmap — uncover what the analysis leaves unexplored
A structured mindmap connects the central concepts to questions that expose assumptions, investigate causal mechanisms, reveal overlooked patterns and test competing explanations. Consultants can examine what would invalidate an initial market hypothesis, identify missing evidence and explore alternative interpretations before committing to a recommendation, creating more productive discussions and more defensible conclusions.
Together, the three components turn complex research into a reusable analytical blueprint: understand the principles, visualize the relationships, and question the explanation. Engagement teams gain a shared foundation for synthesis, collaborative problem-solving, client workshops and future engagements.
Two situations where this pays for itself
The intern entering an unfamiliar industry. A summer intern receives hundreds of pages of sector research, client background and industry terminology. The six advance-organizer cards provide a conceptual framework, the illustrated map makes relationships easier to understand, the evidence-backed summary directs attention to the central arguments — and the driving questions help the intern identify substantive issues to investigate and prepare for discussions with senior colleagues.
The engagement manager reviewing twelve reports. Twelve analysts submit 30-page reports, creating 360 pages of research. The manager uses standardized summaries to locate central claims, source quotations and supporting evidence, then reviews the maps to compare findings and identify unresolved questions — a structured starting point for deciding which original documents require closer inspection and which analysts need additional direction.
Built for every role on the team
| Persona | Core problem | y2map demonstration | Value |
|---|---|---|---|
| Summer Intern | Limited familiarity with an industry and its terminology | Six advance organizers from selected industry reports, illustrated examples, supporting evidence and questions | Faster orientation and more useful participation in team discussions |
| Business Analyst | Large volumes of market research, interviews and financial reports | Central claims, supporting quotations and conceptual relationships, with questions that identify weak assumptions | More time for interpretation and analysis |
| Associate Consultant | Findings from different workstreams are difficult to integrate | Visual representation of the client's situation, showing dependencies and alternative explanations | Clearer problem structuring, more focused research priorities |
| Engagement Manager | Reviewing extensive research produced by multiple analysts | Standardized summaries identifying central arguments, evidence and unresolved assumptions, then map comparison | Faster initial review, more targeted quality assurance |
| Principal / Director | Needs to understand several engagements simultaneously | High-level maps, six-card overviews of project findings and outstanding questions | Faster project orientation, more focused reviews |
| Managing Partner | Valuable expertise remains buried in completed deliverables | Selected engagement materials converted into reusable frameworks, learning resources and question libraries | Greater reuse of intellectual capital |
| KM Director | Large archives are difficult to navigate and repurpose | Approved materials organized into structured learning assets with visual relationships and advance organizers | More accessible institutional knowledge |
| Strategy Consultant | Initial hypotheses can obscure alternative explanations | Driving questions that identify assumptions, competing hypotheses and unexplored possibilities | More systematic exploration of the solution space |
| Change Consultant | Complex organizational changes are difficult to explain consistently | Illustrated maps of processes, dependencies, stakeholder concerns and unresolved questions | Clearer change communication, reusable resources |
360 pages. One structured review.
Spend less time locating the argument. More time structuring the problem, testing hypotheses and identifying what the evidence leaves unresolved.
The flagship AI research synthesis workflow applies the problem-structuring tradition associated with Barbara Minto and McKinsey to complex research: organize the evidence around a coherent problem, expose causal relationships and give the engagement team a shared foundation for reaching its own conclusions.
12 analyst reports. 30 pages each. 360 pages of research.
-
Establish the conceptual structure. Generate the advance-organizer cards that distill the reports' key mental models, central arguments and underlying relationships. Give analysts a shared framework for understanding the research before examining individual findings.
-
Surface the evidence. Extract important facts, direct quotations, source references and supporting evidence into standardized summaries. Identify claims, unresolved assumptions, missing information and contradictions that warrant further investigation.
-
Connect findings across workstreams. Use illustrated learning panels to make abstract concepts intuitive and map relationships across commercial, financial and operational evidence. Reveal recurring patterns, dependencies and anomalies that remain difficult to recognize across separate reports.
-
Structure the investigation. Use a Socratic questioning mindmap to develop diagnostic questions, organize issues into an issue tree, test competing hypotheses and identify the evidence needed to evaluate each explanation. Ask what evidence would prove or disprove a hypothesis, which variables could explain an observed outcome, and what the current research leaves unanswered.
-
Build the recommendation brief. Consolidate the evidence, source references, recurring patterns, contradictions, analytical blindspots and open questions into a structured review. Give the engagement team a common basis for brainstorming, additional research and client decision-making while leaving interpretation, judgment and recommendations to the consultants.
What an evidence-backed summary looks like
Observed fact — Customer concentration creates potential revenue dependency.
"Three enterprise customers contributed 46% of annual recurring revenue." — Example analyst report, p. 14.
Supporting evidence: Two of the three customers have contracts approaching renewal, while the report identifies limited diversification in the current sales pipeline.
Unresolved question: How sensitive is the growth forecast to changes in the largest customers' contract values?
Evidence to investigate: Customer-level renewal probabilities, contract values, historical churn, pipeline conversion rates and revenue forecasts under alternative scenarios.
The six advance-organizer cards establish the conceptual framework for interpreting customer concentration and revenue risk. The illustrated learning panels make the relationships among retention, renewals, pipeline diversification and forecast sensitivity easier to understand. The Socratic questioning mindmap then organizes the next investigation: which variables matter, which assumptions remain untested, which patterns connect the evidence, and which additional facts would resolve the uncertainty?
The resulting recommendation brief is an analytical blueprint. It consolidates what the sources establish, makes relationships and inconsistencies visible, identifies hypotheses requiring tests, and surfaces the questions the team must answer. Consultants use that shared understanding to direct further research, brainstorm alternative explanations and develop defensible recommendations for the client.
Bring every workstream around the same blueprint
A consulting engagement resembles an architectural project: different specialists investigate different parts of a complex system, but their findings must eventually fit together. One problem. Multiple workstreams. A shared picture.
y2map's visual learning maps provide a common reference for that discussion. Analysts contribute findings, associates identify relationships between workstreams, engagement managers interrogate the evidence, and partners challenge the implications. The map is not the recommendation — it is the shared intellectual foundation from which the team develops one.
| Traditional consulting workflow | Shared-blueprint alternative | Value |
|---|---|---|
| Analysts independently read overlapping reports | Each analyst prepares a structured, source-backed view of the assigned material | Less duplicated initial reading |
| Associates consolidate findings into separate slide decks | Workstream findings share one conceptual framework with visual relationships | Easier identification of dependencies |
| Managers review reports sequentially | Managers begin with standardized summaries and investigate selected sources | More targeted document review |
| Teams debate recommendations without a common evidence base | Participants examine evidence, competing explanations and open questions together | More structured discussions |
| Partners receive condensed conclusions without context | Partners review high-level maps and advance organizers with access to evidence | Better-informed review conversations |
| Completed engagements disappear into archives | Approved deliverables become reusable summaries, maps and question libraries | Institutional knowledge reuse |
The 60-minute engagement synthesis workshop
| Stage | Time | Activity | y2map contribution |
|---|---|---|---|
| Prepare | Before meeting | Analysts create standardized summaries from approved source documents and verify consequential claims | Evidence-backed summaries |
| Establish context | 5 min | Review the client's situation, central problem and major workstreams | Six advance-organizer cards |
| Connect findings | 15 min | Examine relationships between financial, operational, commercial and organizational findings | Illustrated knowledge maps |
| Challenge assumptions | 20 min | Investigate conflicting evidence, alternative hypotheses and missing information | Driving questions |
| Prioritize research | 15 min | Identify which uncertainties materially affect the team's conclusions | Evidence and question review |
| Agree on next steps | 5 min | Assign further verification and clarify the remaining analytical work | Reviewed map and documented decisions |
A useful extension: revisit the driving questions after the meeting. Analysts attempt to answer them from memory, compare their explanations with the source material and update their understanding as new evidence emerges.
(This is a facilitated workflow using y2map outputs, not a claim that y2map currently supports simultaneous multi-user editing.)
Understand unfamiliar industries faster
AI market research should produce orientation, not a pile of PDFs. For analysts and interns entering a new sector, y2map builds the conceptual scaffolding first: six illustrated cards explaining the industry's structure and economics, an evidence-backed summary of the central research, a visual map of the players, forces and relationships — and an initial research-question set that turns passive reading into directed investigation.
A junior consultant can read the advance-organizer cards, predict the central argument of an industry report, examine the evidence-backed summary and then test whether the report's conclusions actually follow from its evidence. That is the difference between consuming research and analyzing it.
Challenge your initial hypothesis
Hypothesis-driven problem solving depends on being able to falsify your own thinking. y2map's driving questions operationalize that discipline: they surface the assumptions behind an initial explanation, generate alternative hypotheses, and identify the evidence that would distinguish competing possibilities.
Use the illustrated map to structure the problem space — issues, causes, candidate solutions and their dependencies. A visual map helps consultants organize issues and spot overlaps; it does not automatically produce a MECE analysis, and the judgment remains yours. That is exactly the point: AI-assisted understanding, human-led judgment.
Review the evidence without losing the bigger picture
Engagement managers and principals juggle multiple projects, each generating its own stream of research. y2map gives every engagement a standardized, inspectable overview:
- Evidence-backed summaries of each analyst report, with quotations and page references ready for verification.
- Six-card overviews of project findings for fast orientation across a portfolio.
- High-level visual maps connecting findings, evidence and outstanding questions.
- Driving questions that direct the next round of analysis instead of generic "next steps."
The result is a stronger executive briefing foundation: concise conclusions supported by inspectable evidence, and a review conversation that starts from shared understanding rather than condensed conclusions without context.
Make every engagement a source of reusable knowledge
The most expensive research a firm owns is the work it has already paid for. Consulting knowledge management with y2map turns approved historical deliverables into a reusable internal library:
- Evidence-backed summaries for fast access to prior findings.
- Reusable conceptual frameworks and illustrated learning maps for onboarding and knowledge transfer.
- Question libraries for retrieval practice and future engagement preparation.
- Shareable visual content — publication-quality infographics derived from approved, non-confidential research, extending from internal knowledge reuse to external thought leadership on LinkedIn and in industry reports.
Each new engagement stops reconstructing the same foundational knowledge, and starts from an institutional memory the whole firm can navigate.
Know where the argument comes from
Consulting deliverables carry accountability, which is why every claim in a y2map summary is anchored to its source: a direct quotation, a page reference or timestamp, and the surrounding original context one click away.
- Traceable findings — inspect the passage behind every mental model.
- Honest limits — source references support verification; they do not guarantee an interpretation is correct. Consequential claims still deserve human review.
- Questions that flag uncertainty — the driving questions explicitly mark unsupported conclusions and missing evidence.
- Confidentiality discipline — shareable assets are derived only from approved, non-confidential material.
This is AI-assisted synthesis designed for human oversight, not automated strategic recommendations.
What consulting research tells us about AI
Published research and real-world examples support the direction — and the caution. These are externally reported results, clearly distinguished from y2map's own capabilities.
| Case study or research | Documented or reported finding | Lesson for research teams |
|---|---|---|
| McKinsey's Lilli | McKinsey reports up to 30% of time saved in information searching and synthesis and roughly 72% active adoption across the firm, alongside improvements in content quality and accuracy (McKinsey's own published results). | Making existing intellectual capital accessible has measurable organizational value. |
| Harvard Business School / BCG experiment | In a 2023 experiment with 758 consultants, AI-assisted participants completed certain tasks faster and at higher assessed quality — but results varied across task types. | Combine AI-assisted preparation with deliberate human verification and critical questioning. |
| BCG research on AI-assisted problem solving | Researchers found AI assistance could reduce performance on a deliberately difficult business problem-solving task, encouraging overreliance on plausible but incorrect answers. | Plausible summaries require scrutiny: inspect evidence, generate alternatives. |
| EY and Bayer | EY describes a proof-of-concept system making Bayer's specialist agronomic knowledge more accessible to advisors. | Specialist expertise can be organized into frameworks and visual explanations for a wider professional audience. |
Illustrative y2map scenarios
These are examples of how the workflow applies — labeled as such until demonstrated with actual customers.
| Scenario | Source material | Output | What to measure |
|---|---|---|---|
| 360-page engagement review | Twelve 30-page analyst reports | Structured engagement review and visual research maps | Review time, consequential issues identified |
| New-industry orientation | Sector reports, client background, market research | Illustrated industry learning map | Preparation time, demonstrated understanding |
| Market-entry strategy | Market research, customer interviews, competitor analysis | Market-entry problem map with evidence and hypothesis questions | Research coverage, quality of identified uncertainties |
| Cross-workstream synthesis | Financial, operational and commercial analyses | Shared engagement blueprint | Meeting preparation time, unresolved cross-workstream issues |
| Institutional knowledge reuse | Approved historical deliverables, retrospectives | Internal learning library | Reuse frequency, avoided preparation effort |
| Organizational change | Process documents, stakeholder interviews, change plans | Illustrated change communication map | Stakeholder understanding, preparation time |
Understand more research. Reduce the clarity tax.
Two economic promises, one product story:
Create more value. Turn existing reports, research and client documents into evidence-backed summaries, visual learning resources and questions that support further analysis. Repurpose approved research into internal training materials, reusable frameworks and shareable thought-leadership images.
Recover wasted resources. Make complex research easier to navigate, question and communicate. Give new consultants a conceptual starting point, help engagement managers review extensive reports, and make previous project knowledge easier to reuse.
Evaluate both honestly — baseline measurements, controlled pilot comparisons, and improvement that is demonstrated rather than assumed.
Why this works: the learning science behind the maps
Each output applies a documented principle from learning research to consulting work:
| Learning principle | y2map feature | Consulting benefit |
|---|---|---|
| Advance organizers (Ausubel) | Six high-level takeaway cards | Understand an unfamiliar industry's structure before detailed research |
| Concept mapping (Novak) | Central map connecting concepts, evidence and examples | Relationships between problems, findings and explanations become inspectable |
| Dual coding | Illustrated examples combined with explanatory text | Complementary visual and verbal representations of complex concepts |
| Cognitive load theory | Structured summaries and manageable sections | Less effort navigating fragmented information |
| Picture superiority effect | Distinctive, meaningful illustrations | Memorable cues for important concepts and relationships |
| Distributed cognition | External workspace of concepts, evidence and questions | A shared reference during analysis and review |
| Generative learning (Wittrock) | Questions requiring constructed explanations | Connect findings with existing industry knowledge |
| Generation effect | Prompts to formulate answers before reading explanations | Active engagement with unfamiliar research |
| Elaborative retrieval | Questions linking several concepts | Reconstruct and deepen understanding of an argument |
| Abductive reasoning (Peirce) | Questions about hidden mechanisms and competing explanations | Generate plausible hypotheses and the evidence that would distinguish them |
| ICAP framework (Chi) | Reading, annotating, explaining and discussing maps | Progressively more constructive engagement with research |
| Scaffolding (Vygotsky) | Examples, advance organizers and guided questions | Structured support for unfamiliar subjects |
| Schema theory | Repeated conceptual structures across examples | New information organizes into coherent mental models |
| Semantic network models | Visual relationships between related ideas | Connections across workstreams, industries and previous engagements |
| Retrieval practice | Questions revisited without the source material | Later recall that reveals gaps in understanding |
These principles describe learning opportunities supported by the design; their actual effects should be evaluated through user testing.
Common questions about AI research in consulting
How can AI help management consultants? Through document review, initial synthesis, visual learning and research-question generation — the four complementary outputs that move a team from information to shared understanding.
Can AI summarize multiple consulting reports? Yes, with standardized evidence-backed summaries whose findings can be compared across reports — claims, quotations, evidence and unresolved questions side by side.
How do consultants verify AI-generated research? Source quotations, page references, original-document inspection and human review of every consequential claim.
How can consulting teams synthesize multiple workstreams? Through the shared-blueprint workflow: findings represented in one conceptual framework, visual relationships exposing dependencies, and guided questions steering the discussion.
How can AI support hypothesis-driven consulting? Driving questions expose assumptions, generate alternative explanations and identify the evidence needed to verify or falsify each one.
How can consulting firms reuse previous project knowledge? Approved deliverables become reusable summaries, frameworks, learning maps and question libraries — institutional knowledge instead of archives.
How can firms measure AI research productivity? Baseline measurements and controlled pilot comparisons: review time, issues identified, reuse frequency and research quality.
What is an advance organizer in consulting research? Six high-level conceptual cards that establish a subject's structure before analysts read the detailed reports.
How can mindmaps improve consulting research? Illustrated relationships help consultants organize complex information, identify conceptual connections and see dependencies across findings.
Can AI help consultants identify alternative hypotheses? Yes — through questions that investigate assumptions, generate explanations and specify the evidence that would distinguish competing possibilities.
How can consulting firms turn research into reusable training materials? One approved source becomes summaries, advance organizers, illustrated maps and question sets for onboarding, coaching and retrieval practice.
Can consulting research become shareable visual content? Yes — publication-quality illustrated maps derived from approved, non-confidential research, suitable for LinkedIn and industry publications.
Turn your next research project into a shared blueprint
One source in. Four ways to understand it. An engagement team that gets to the argument faster, challenges it together, and reuses what it learns.
Create your research blueprint — or see the 360-page review workflow on a real, permission-cleared example: the original report beside its evidence-backed summary, six advance-organizer cards, illustrated knowledge map and the driving questions your team will argue about in the best possible way.